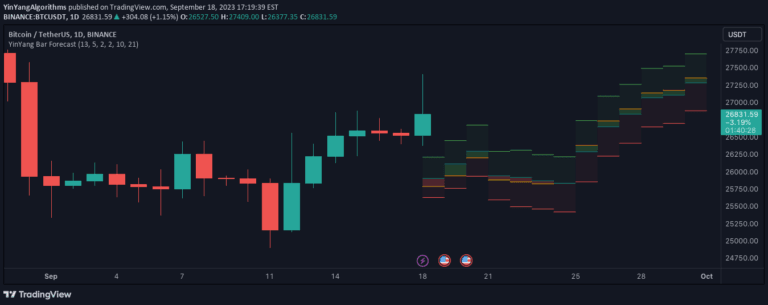
A daily trading bias indicator that predicts market direction by comparing the current day's opening price to the previous day's price levels, offering bullish, bearish, or neutral forecasts.
Explore complementary indicator rolesHow it works
The Forecast Daily BIAS indicator analyzes the relationship between the current day's opening price and the previous day's price levels. It calculates the market's potential directional bias by comparing the opening price to the previous day's close, high, and low prices.
When the opening price is higher than the previous day's close and above the average of the previous day's high and low, the indicator generates a bullish signal. Conversely, if the opening price is lower than the previous day's close and below the average of the previous day's high and low, it generates a bearish signal. If neither condition is met, the indicator remains neutral.
Why it may be useful
The Forecast Daily BIAS indicator provides traders with a quick, visual assessment of potential market direction, helping them make more informed trading decisions. By offering an immediate perspective on the day's probable price movement, traders can quickly gauge market sentiment and adjust their strategies accordingly.
This indicator is particularly valuable for day traders who need to make rapid decisions based on short-term price dynamics. It simplifies market analysis by reducing complex price data into a straightforward bullish, bearish, or neutral forecast, allowing traders to quickly understand the day's potential market trajectory.
When to explore it
The Forecast Daily BIAS indicator is most effective in markets with clear daily price patterns and consistent intraday trends. It works best in liquid markets with sufficient trading volume, such as major stock indices, forex pairs, and actively traded commodities. Traders should use this indicator in conjunction with other technical analysis tools and fundamental market research.
It is particularly useful during periods of relatively stable market conditions when daily price movements follow more predictable patterns. However, during high volatility or significant economic events, traders should exercise additional caution and not rely solely on this indicator.
Keep exploring
What we’ve verified
Access, alerts and repainting behaviour have not been independently verified for this indicator. Check the creator’s current publication and settings.
General descriptions and classifications are recovered research. Verified details above identify the specific checks we have completed. Check the creator’s current publication for later changes.