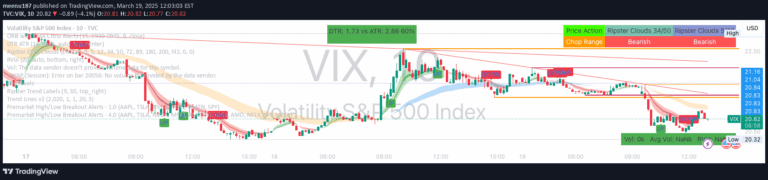
A dynamic indicator that tracks previous candle high and low levels across multiple timeframes, providing key support and resistance reference points for traders' strategic decision-making.
Explore complementary indicator rolesHow it works
The Previous 4-Hour High/Low Lines indicator automatically identifies the high and low price levels from the most recent candle in a selected timeframe, typically 4 hours. It then extends these levels horizontally across the entire chart, creating visual reference lines that remain static until the next candle forms.
These extended lines create a visual framework that helps traders quickly recognize potential support and resistance zones. The lines dynamically update with each new candle, ensuring that traders always have the most recent significant price levels mapped out on their chart.
Why it may be useful
By providing clear visual markers of recent significant price levels, this indicator helps traders make more informed trading decisions across different timeframes. It eliminates the need for manual tracking and allows traders to quickly identify potential entry, exit, and stop-loss points based on recent market movements.
The indicator's flexibility in timeframe selection makes it a versatile tool for traders who want to incorporate higher timeframe analysis into their trading strategy. It bridges the gap between different chart perspectives, enabling more comprehensive market analysis and potentially improving trade timing and risk management.
When to explore it
This indicator is most effective in markets with clear directional moves and when traders want to understand the broader context of price action beyond their current trading timeframe. It works particularly well in trending markets where recent high and low levels can serve as significant reference points for future price movement.
Traders can benefit from this tool during range-bound markets, breakout scenarios, and when analyzing potential support and resistance levels. It is especially useful for day traders, swing traders, and scalpers who need quick visual cues about recent market structure and potential price turning points.
Keep exploring
What we’ve verified
Access, alerts and repainting behaviour have not been independently verified for this indicator. Check the creator’s current publication and settings.
General descriptions and classifications are recovered research. Verified details above identify the specific checks we have completed. Check the creator’s current publication for later changes.