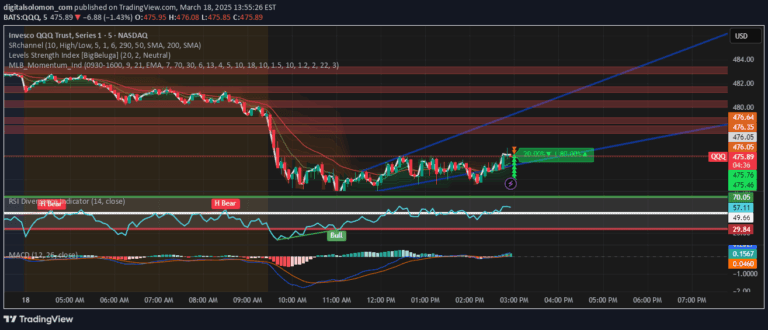
A multi-indicator sentiment analysis tool that identifies and highlights market bias zones using RSI, MACD, and OBV to help traders detect sustained bullish or bearish market conditions.
Explore complementary indicator rolesHow it works
The Frozen Bias Zones indicator analyzes three key market metrics: RSI, MACD, and OBV to determine market sentiment. By examining these indicators simultaneously, it assesses whether the market is in a bullish or bearish phase, with specific criteria for each metric's evaluation.
When all three indicators align in a consistent direction for a specified number of candles, the indicator creates a color-coded zone representing the dominant market bias. Green zones indicate bullish sentiment, while red zones represent bearish conditions, providing traders with a visual representation of sustained market momentum.
Why it may be useful
This indicator offers traders a comprehensive view of market sentiment by combining multiple technical indicators into a single, easy-to-understand visualization. By synchronizing RSI, MACD, and OBV, it provides a more robust analysis of market direction than relying on a single indicator.
The Frozen Bias Zones tool helps traders identify prolonged market trends, potentially reducing false signals and improving decision-making. Its ability to highlight sustained market biases and detect breakout points can help traders recognize emerging trend changes and make more informed trading decisions.
When to explore it
The Frozen Bias Zones indicator is most effective in markets with clear, sustained trends where multiple technical indicators consistently show the same directional bias. It works well in trending markets across various timeframes, from short-term scalping to longer-term swing trading scenarios.
Traders should use this indicator in conjunction with other technical and fundamental analysis tools to confirm signals and develop comprehensive trading strategies. It is particularly useful during periods of consistent market momentum, helping traders identify and potentially capitalize on extended bullish or bearish market conditions.
Keep exploring
What we’ve verified
Access, alerts and repainting behaviour have not been independently verified for this indicator. Check the creator’s current publication and settings.
General descriptions and classifications are recovered research. Verified details above identify the specific checks we have completed. Check the creator’s current publication for later changes.