
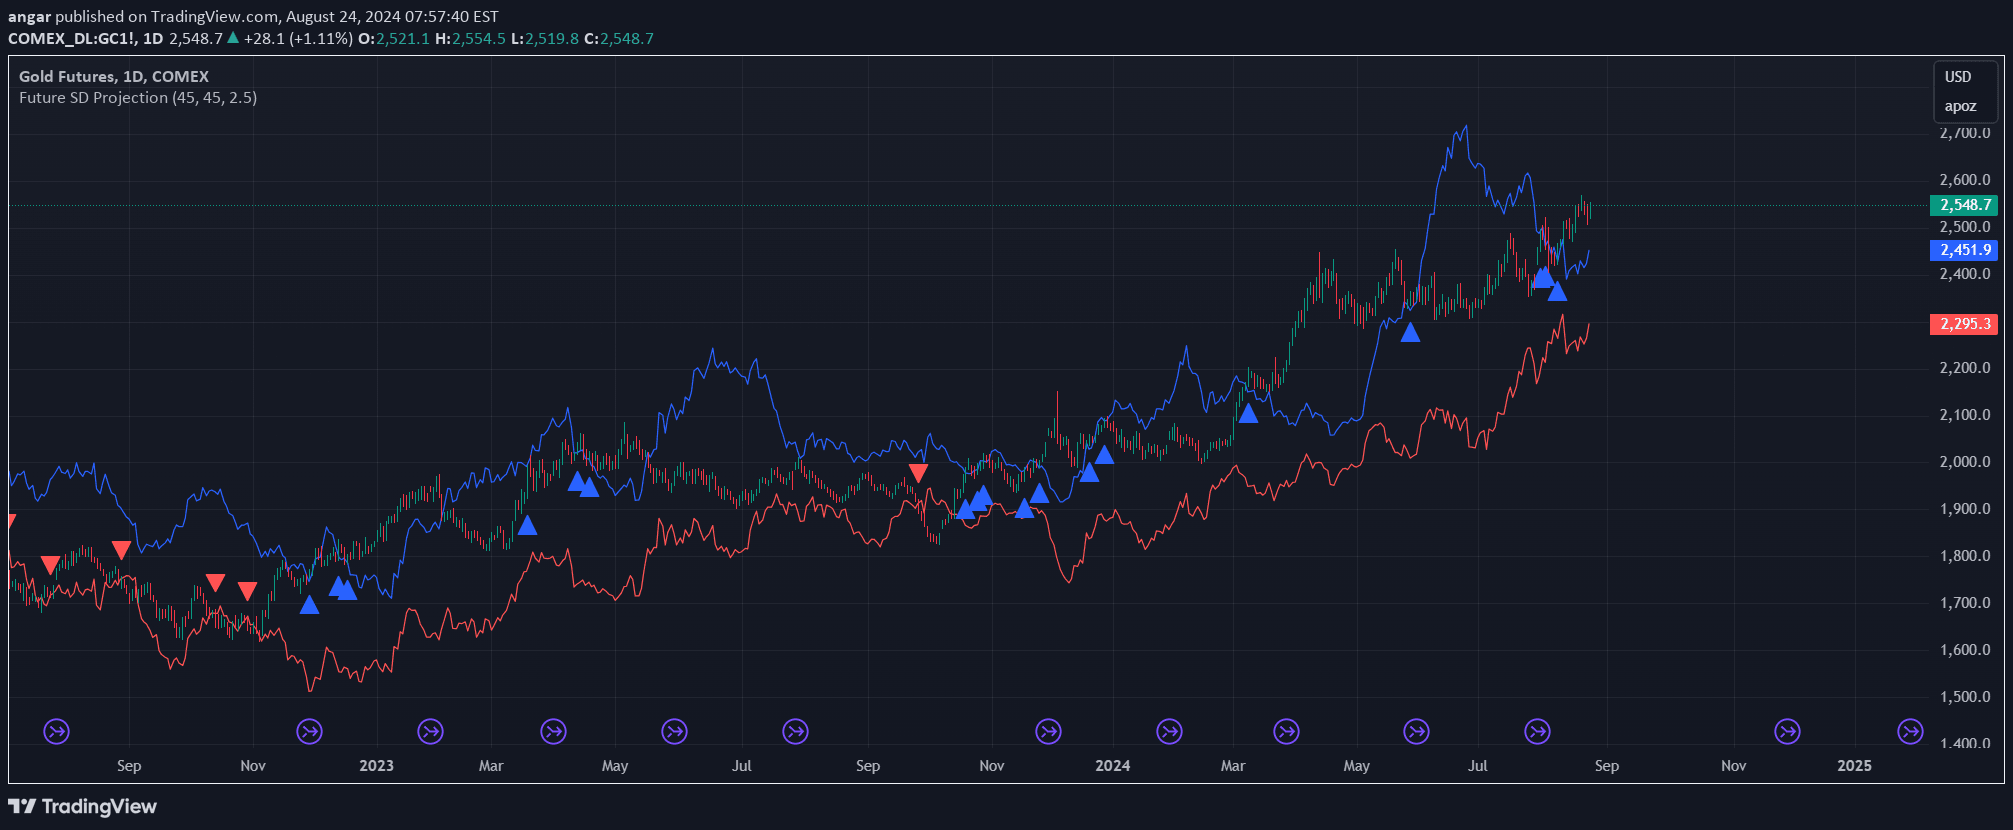
A forward-looking volatility indicator that projects standard deviation bands into the future, helping traders anticipate potential price ranges and breakout levels with customizable settings.
Explore complementary indicator rolesHow it works
The Future Standard Deviation Projector begins by calculating the standard deviation of recent closing prices, which measures the price dispersion around the mean. It uses a configurable lookback period to determine the recent price volatility, analyzing how much prices have deviated from their average value.
Once the standard deviation is calculated, the indicator projects upper and lower bands into the future based on the computed volatility. These projected bands are plotted on the chart, extending forward in time, and provide a visual representation of potential price movement ranges. When the current closing price crosses these projected bands, the indicator generates clear visual signals or arrows to alert traders.
Why it may be useful
The Future Standard Deviation Projector offers traders a unique forward-looking perspective on potential price movements by quantifying and visualizing expected volatility. By projecting standard deviation bands, it helps traders anticipate possible price ranges and understand potential market behavior before it occurs.
This indicator is valuable because it transforms abstract statistical concepts into actionable trading insights. Traders can use these projected bands to identify potential breakout levels, assess market volatility expectations, and make more informed decisions about entry and exit points, ultimately enhancing their overall trading strategy with a predictive analytical tool.
When to explore it
The Future Standard Deviation Projector is most effective in markets with moderate to high volatility, where price movements are more likely to deviate from their mean. It works particularly well in trading environments with clear trend characteristics, such as forex, futures, and actively traded stocks where price fluctuations are more predictable.
Traders should consider using this indicator during periods of market uncertainty, when traditional technical analysis might provide limited insights. It is especially useful when combined with other analysis methods, helping to confirm potential trade setups, identify potential breakout zones, and provide an additional layer of analytical depth to trading decisions.
Keep exploring
What we’ve verified
Access, alerts and repainting behaviour have not been independently verified for this indicator. Check the creator’s current publication and settings.
General descriptions and classifications are recovered research. Verified details above identify the specific checks we have completed. Check the creator’s current publication for later changes.


