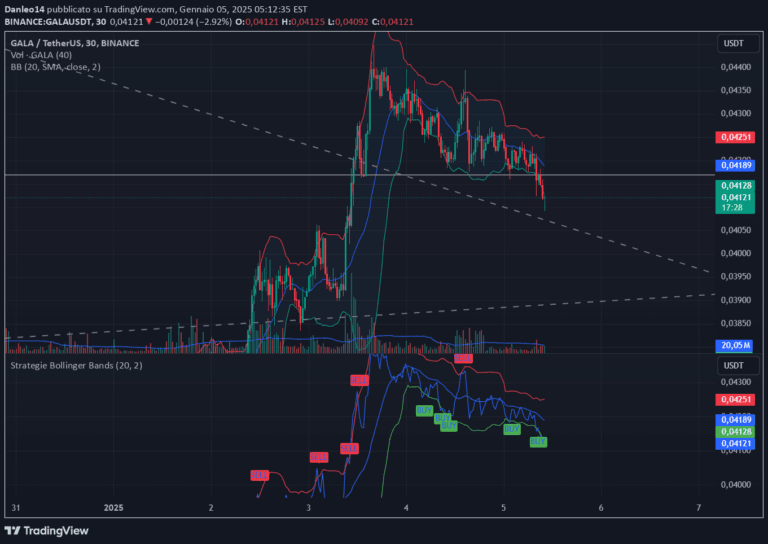
A comprehensive trading indicator combining Bollinger Bands, ATR, and Fractals to assess market volatility, identify potential entry/exit points, and highlight price reversal opportunities.
Explore complementary indicator rolesHow it works
The Bollinger Bands + ATR with Fractal indicator integrates multiple technical analysis tools to provide a comprehensive market analysis. Bollinger Bands are created by plotting two standard deviation lines around a simple moving average, which dynamically expand and contract based on market volatility.
The Average True Range (ATR) measures market volatility by calculating the average price range over a specific period. Fractals identify potential reversal points by marking peaks and troughs in the price action, with arrows indicating possible trend changes. Together, these components create a robust framework for understanding market dynamics and potential trading opportunities.
Why it may be useful
This indicator is crucial for traders seeking a multi-dimensional approach to market analysis that goes beyond single-metric evaluations. By combining volatility measurement, trend identification, and potential reversal signals, traders can make more informed decisions about market entry and exit points.
The integrated approach helps traders understand not just price movement, but the underlying market conditions that drive those movements. This comprehensive view reduces trading risk by providing multiple layers of technical confirmation and helping traders identify high-probability trading opportunities across different market conditions.
When to explore it
The Bollinger Bands + ATR with Fractal indicator works best in markets with clear trend structures and moderate to high volatility. It is particularly effective in identifying potential trend reversals, breakout opportunities, and periods of market consolidation.
Traders should utilize this indicator when seeking to confirm trend strength, assess market volatility, and pinpoint potential entry and exit points. It is especially useful in trending markets where price movements are more predictable and when traders want to combine multiple technical analysis perspectives to validate their trading decisions.
Keep exploring
What we’ve verified
Access, alerts and repainting behaviour have not been independently verified for this indicator. Check the creator’s current publication and settings.
General descriptions and classifications are recovered research. Verified details above identify the specific checks we have completed. Check the creator’s current publication for later changes.