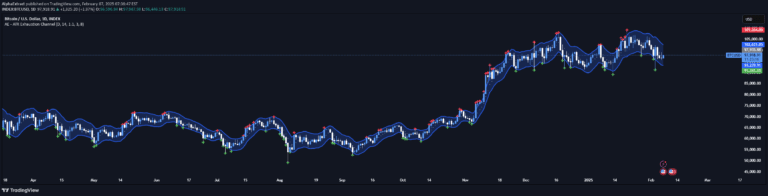
Alpha Fractal Bands combine Williams Fractals and Bollinger Bands to identify potential price reversals and support/resistance levels with enhanced trading insights.
Explore complementary indicator rolesHow it works
The Alpha Fractal Bands system integrates Williams Fractals' support and resistance identification with Bollinger Bands' volatility analysis. By detecting price extremes and market volatility, traders can pinpoint potential reversal points and trend shifts. The method identifies key price levels where market momentum might change direction.
Traders use these bands to recognize critical price points by analyzing fractal formations and band expansions or contractions. The system provides visual cues about market dynamics, helping traders understand potential entry and exit points with greater precision and confidence.
Why it may be useful
The Alpha Fractal Bands provide traders with a sophisticated approach to understanding market movements and potential trend reversals. By combining multiple technical analysis tools, the method offers more robust insights than traditional single-indicator strategies. Traders gain a nuanced perspective on market volatility and potential price action.
This approach helps traders make more informed decisions by offering multiple layers of market analysis. The integrated method reduces false signals and provides a more comprehensive view of potential trading opportunities, ultimately supporting more strategic and calculated trading decisions.
When to explore it
The Alpha Fractal Bands are most effective in markets with clear trend movements and moderate to high volatility. Traders should apply this method in markets like forex, stocks, and cryptocurrencies where price dynamics are more pronounced. The signal works best when combined with additional confirmatory indicators.
Ideal usage includes identifying potential trend reversals, setting stop-loss levels, and determining entry and exit points. Traders should be particularly attentive during market transition periods, such as when price approaches key support or resistance levels or during significant economic announcements.
Keep exploring
What we’ve verified
Access, alerts and repainting behaviour have not been independently verified for this indicator. Check the creator’s current publication and settings.
General descriptions and classifications are recovered research. Verified details above identify the specific checks we have completed. Check the creator’s current publication for later changes.