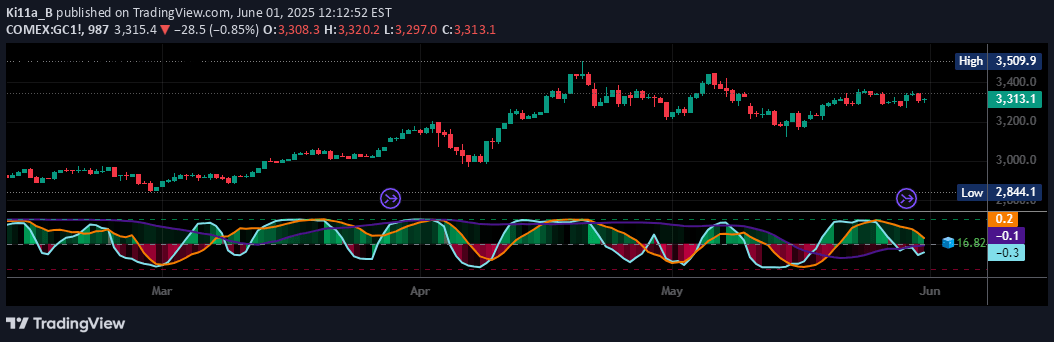
A hybrid trading indicator combining Dynamic RSI Bollinger Bands and Waldo Cloud to analyze market momentum, volatility, and trend direction with enhanced visual clarity.
Explore complementary indicator rolesHow it works
The Waldo Momentum Cloud Bollinger Bands (WMCBB) integrates two powerful technical analysis tools to provide comprehensive market insights. It first calculates dynamic RSI Bollinger Bands that adjust based on momentum, scaling the Relative Strength Index to align with price levels and reveal underlying market dynamics.
Simultaneously, the Waldo Cloud overlays traditional Bollinger Bands with additional moving average layers, creating a color-coded visualization of market trends. The indicator dynamically changes its color scheme based on RSI levels, moving average crossovers, and price positioning, offering traders a multi-dimensional view of market conditions.
Why it may be useful
Traditional trading indicators often provide limited insights, focusing on either momentum or trend in isolation. The WMCBB bridges this gap by simultaneously analyzing multiple market characteristics, giving traders a more holistic understanding of potential price movements and market sentiment.
By combining momentum analysis through RSI with trend identification via the Waldo Cloud, traders gain a nuanced tool that can potentially improve decision-making. The visual simplicity of color-coded bands and cloud formations allows for quick, intuitive market assessment, reducing cognitive load during fast-moving trading scenarios.
When to explore it
The WMCBB excels in sideways or ranging markets where traditional indicators might struggle to provide clear signals. Its dynamic nature makes it particularly useful during periods of market uncertainty, where trend direction and momentum are not immediately apparent.
Traders can leverage this indicator most effectively when seeking to identify potential trend reversals, assess market volatility, and confirm momentum shifts. It is especially valuable for traders who want a comprehensive, visually intuitive tool that goes beyond single-dimensional market analysis.
Keep exploring
What we’ve verified
Access, alerts and repainting behaviour have not been independently verified for this indicator. Check the creator’s current publication and settings.
General descriptions and classifications are recovered research. Verified details above identify the specific checks we have completed. Check the creator’s current publication for later changes.