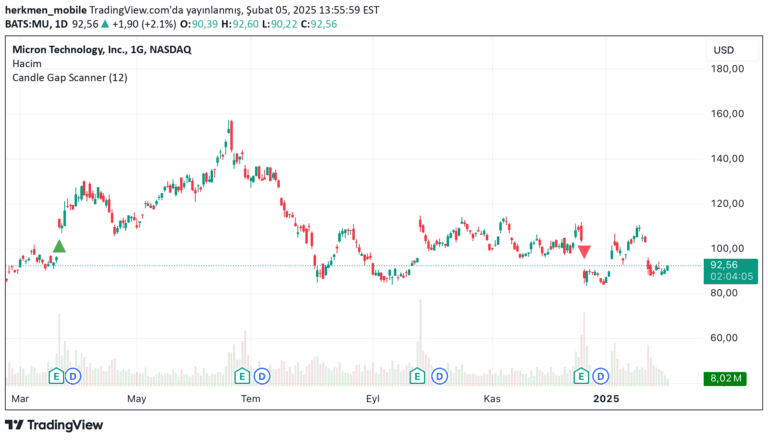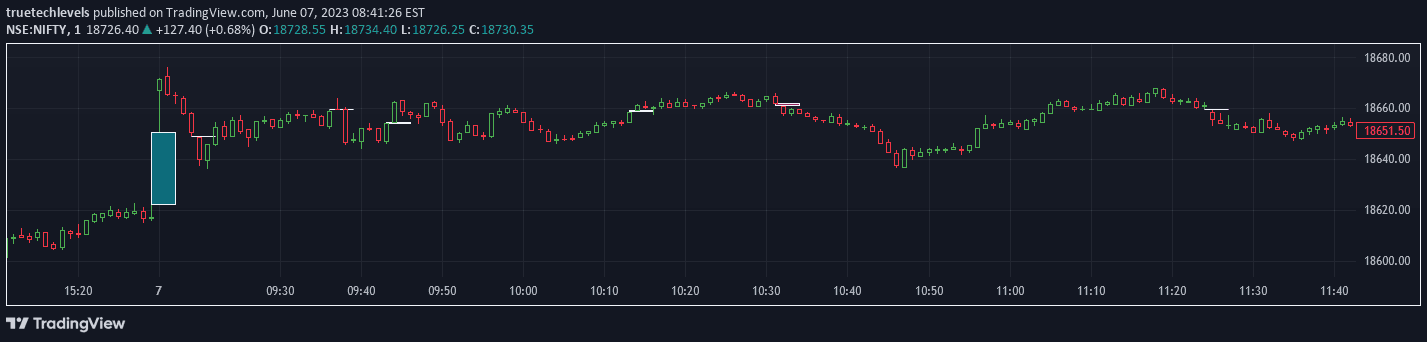
A trading indicator that visually highlights price gaps between bars, helping traders identify price jumps and potential trading opportunities across different timeframes.
Explore complementary indicator rolesHow it works
The gap indicator scans price charts to detect moments where the price changes significantly between two consecutive bars without any trading activity in between. It creates colored boxes to visually mark these gaps, allowing traders to quickly identify price jumps and discontinuities in market movement.
The indicator provides customizable settings for users to modify the appearance of gap highlights, including options to disable opening gaps and focus on smaller, more specific price movements. This flexibility enables traders to tailor the visualization to their specific trading strategy and timeframe preferences.
Why it may be useful
Price gaps represent important market dynamics that can signal potential trading opportunities, shifts in market sentiment, or significant price momentum. By highlighting these gaps, traders can quickly identify moments of market discontinuity and assess potential entry or exit points for their trades.
The visual representation helps traders quickly understand price movements that might otherwise be overlooked, providing insights into market volatility and potential trend changes. These gap indicators can be particularly useful for traders seeking to understand rapid price transitions and make more informed trading decisions.
When to explore it
This gap indicator is most effective for traders operating on shorter timeframes, such as day trading and scalping, where rapid price movements are more common and significant. It can help identify potential breakout opportunities, market sentiment shifts, and areas of price discontinuity that might indicate underlying market dynamics.
Traders should use this indicator in conjunction with other technical analysis tools to confirm signals and develop a comprehensive trading strategy. It is particularly useful in markets with high volatility or during periods of significant news events that can cause sudden price jumps.
Keep exploring
What we’ve verified
Access, alerts and repainting behaviour have not been independently verified for this indicator. Check the creator’s current publication and settings.
General descriptions and classifications are recovered research. Verified details above identify the specific checks we have completed. Check the creator’s current publication for later changes.