
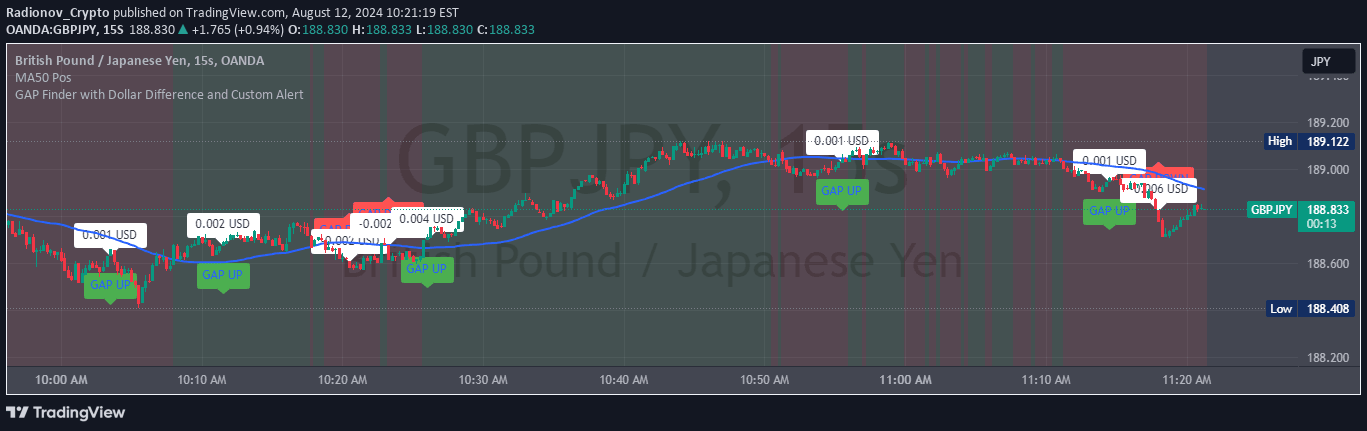
A trading signal that identifies price gaps between consecutive candles, detecting significant market movements by analyzing the relationship between current and previous candle price ranges.
Explore complementary indicator rolesHow it works
The Gap Detection indicator analyzes the relationship between consecutive price candles to identify significant market movements. It determines a GAP UP when the current candle's entire range is positioned above the previous candle's high, and a GAP DOWN when the current candle's entire range is positioned below the previous candle's low.
This method ensures that only complete candle range movements are considered as genuine gaps, providing a precise mechanism for tracking substantial price transitions. The indicator calculates the dollar difference between candles and visually marks the gap on the chart, making it easy for traders to quickly identify and assess market momentum.
Why it may be useful
Gap detection provides traders with critical insights into potential market sentiment and momentum shifts between trading sessions. By highlighting significant price movements, the indicator helps traders understand sudden changes in market dynamics and potential trend reversals or continuations.
The visual representation of gaps allows traders to quickly assess market volatility and make informed decisions about potential entry or exit points. Understanding these price transitions can be particularly valuable during session transitions, where market sentiment can rapidly change.
When to explore it
This indicator is most effective when used on shorter timeframes, particularly the 5-minute chart during trading session transitions. It is especially useful for markets with high liquidity and frequent price movements, such as stocks, cryptocurrencies, and futures trading.
Traders should focus on using this signal during market open periods, session changes, and times of potential high volatility. It works best when combined with other technical analysis tools to confirm potential trading opportunities and validate market movements.
Keep exploring
What we’ve verified
Access, alerts and repainting behaviour have not been independently verified for this indicator. Check the creator’s current publication and settings.
General descriptions and classifications are recovered research. Verified details above identify the specific checks we have completed. Check the creator’s current publication for later changes.


