
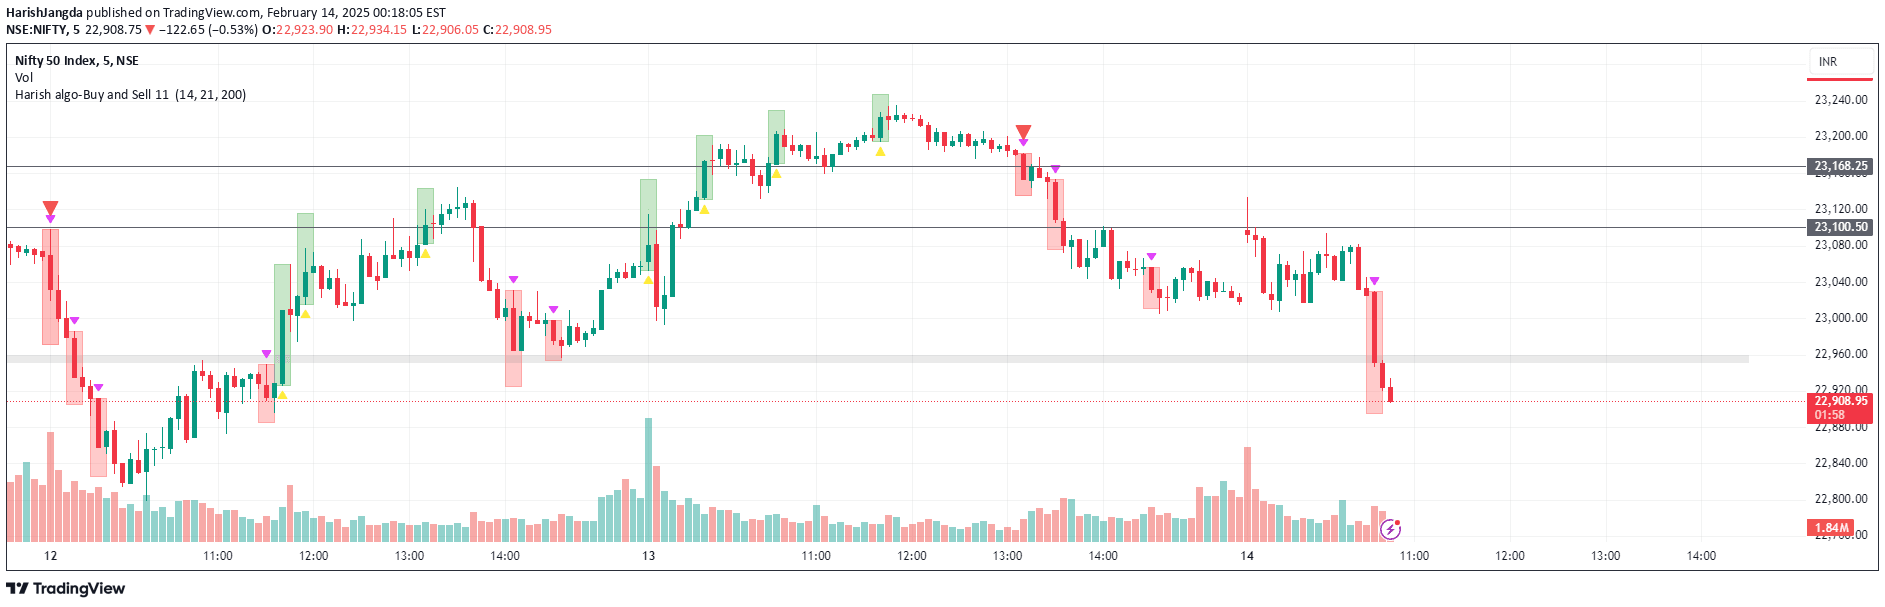
A sophisticated intraday trading indicator for Nifty and Banknifty that combines pivot points, EMAs, and volatility analysis to generate precise buy and sell signals.
Explore complementary indicator rolesHow it works
The Harish Algo generates trading signals by calculating daily pivot points and using three exponential moving averages (21, 55, and 200) to confirm trend direction. It analyzes the last three 15-minute candle closes from the previous day to compute volatility-based price levels and anticipate potential market movements.
The indicator identifies bullish signals when price breaks above key resistance levels and EMAs confirm an uptrend, marked by yellow or green triangles. Conversely, bearish signals occur when price drops below support levels with EMA confirmation of a downtrend, indicated by fuchsia or red triangles.
Why it may be useful
This trading indicator provides traders with a structured approach to identifying potential entry and exit points by combining multiple technical analysis concepts. It reduces false signals by integrating pivot points, exponential moving averages, and price action, offering a comprehensive view of market dynamics.
The algorithm's ability to generate precise signals helps traders make more informed decisions, particularly in the volatile Indian stock markets. By offering customizable settings and real-time alerts, it supports both novice and experienced traders in developing a more systematic trading strategy.
When to explore it
The Harish Algo is most effective for intraday traders focusing on Nifty and Banknifty markets, providing optimal performance on shorter timeframes. It works best when market volatility is moderate and clear trend directions can be established using the EMA indicators.
Traders should apply this indicator during regular market hours, paying close attention to the pivot points, EMA confirmations, and triangle signal markers. It is particularly useful for traders seeking a disciplined approach to identifying potential breakout and breakdown levels in the market.
Keep exploring
What we’ve verified
Access, alerts and repainting behaviour have not been independently verified for this indicator. Check the creator’s current publication and settings.
General descriptions and classifications are recovered research. Verified details above identify the specific checks we have completed. Check the creator’s current publication for later changes.


