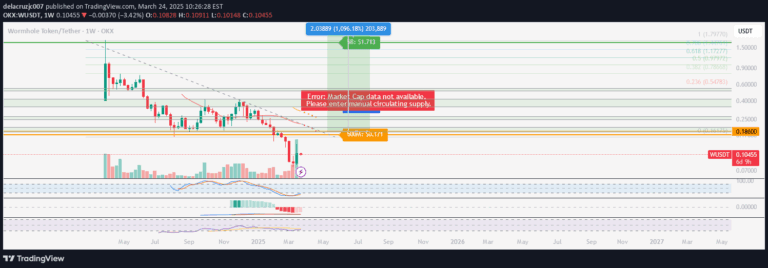
A weekly high and low level indicator that allows traders to visualize higher time frame structure on lower time frame charts with customizable horizontal lines and automatic weekly updates.
Explore complementary indicator rolesHow it works
The indicator selects a past weekly candle and plots its high and low as horizontal lines on the current chart. Traders can choose which week to reference, ranging from the current week to up to five weeks back. The lines remain persistent, providing a visual reference for key price levels across different time frames.
The tool automatically labels these lines with text indicators like Week-3H and Week-3L, corresponding to the selected week's high and low points. As each new week begins, the indicator refreshes, ensuring that the levels and labels remain current and relevant to the trader's chosen time frame.
Why it may be useful
This indicator provides traders with a strategic view of market structure by mapping higher time frame levels onto lower time frame charts. By visualizing key weekly highs and lows, traders can identify potential support and resistance zones, which can significantly improve trading decisions and risk management.
The customizable nature of the indicator allows traders to adapt it to their specific trading style and preferences. With options to modify line colors, width, style, and text label positioning, traders can create a personalized view that enhances their technical analysis and helps them make more informed trading choices.
When to explore it
The weekly level indicator is most effective when traders want to understand broader market context and align their short-term trades with higher time frame structures. It is particularly useful during range-bound markets or when price is approaching significant weekly high or low levels, which can act as potential turning points or continuation zones.
Traders can benefit from this tool across various markets and asset classes, including stocks, forex, cryptocurrencies, and commodities. It is especially valuable for day traders and swing traders who need to maintain perspective on longer-term market dynamics while executing shorter-term trading strategies.
Keep exploring
What we’ve verified
Access, alerts and repainting behaviour have not been independently verified for this indicator. Check the creator’s current publication and settings.
General descriptions and classifications are recovered research. Verified details above identify the specific checks we have completed. Check the creator’s current publication for later changes.