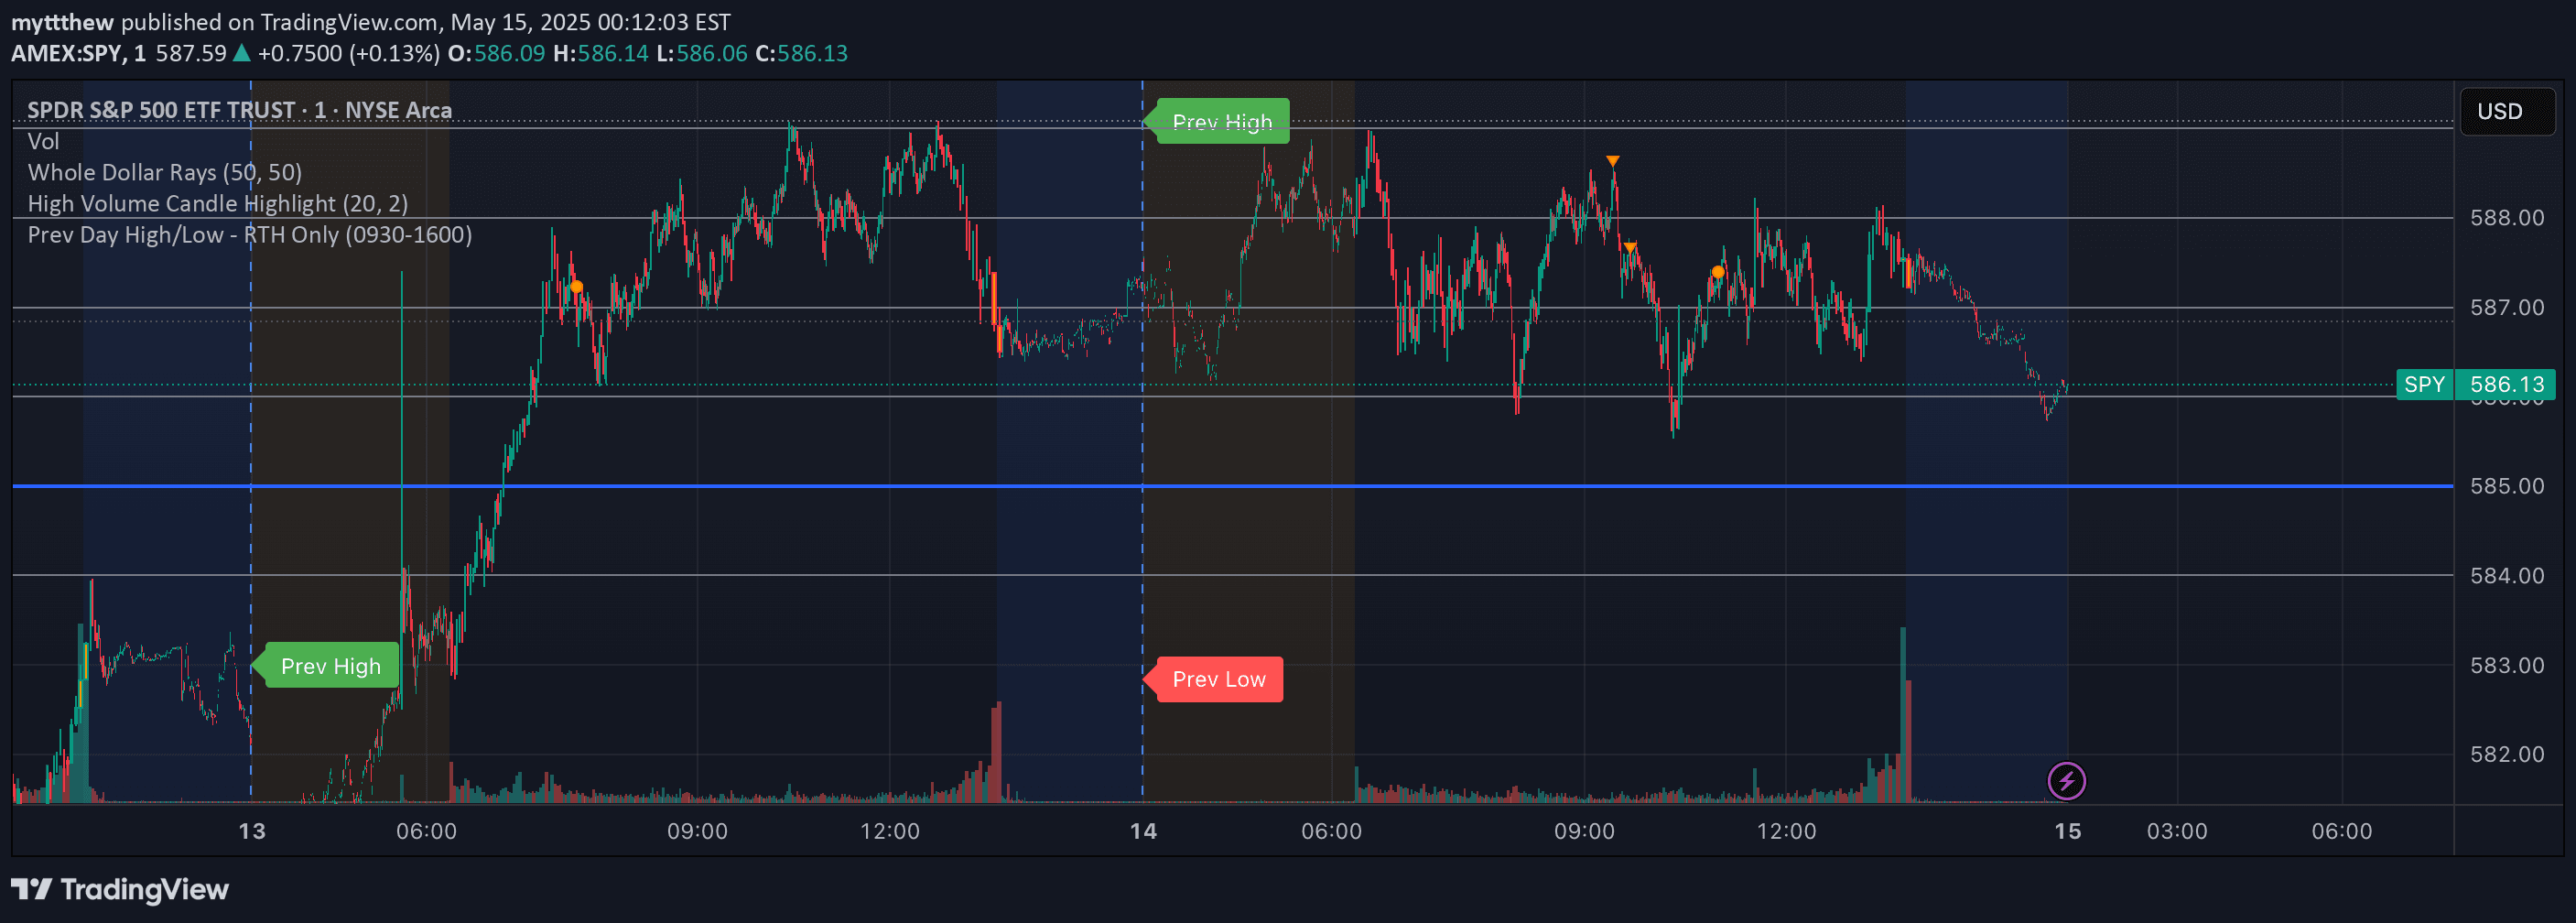
An advanced script that automatically identifies and marks significant price highs and lows on trading charts, helping traders visualize key reversal points and potential support/resistance levels.
Explore complementary indicator rolesHow it works
The Ultra High/Low script uses Pine Script's pivot detection functions to identify significant price turning points by analyzing surrounding price bars. It specifically looks for pivot highs and lows by comparing price levels across multiple bars, determining local maximum and minimum points where price potentially reversed direction.
Once these pivot points are detected, the script automatically draws dashed lines from the pivot point to the current price bar, creating visual markers of historical price behavior. The script also adds labels showing the exact price and whether the point represents a Previous Day High/Low or Previous Week High/Low, providing traders with detailed contextual information about these critical price levels.
Why it may be useful
Identifying key price levels is crucial for understanding market dynamics and potential future price movements. By automatically marking significant highs and lows, the script helps traders quickly recognize historical price turning points without manual chart analysis, which can be time-consuming and subjective.
These visual markers provide traders with immediate insights into potential support and resistance zones, helping them make more informed trading decisions. The ability to see where price has previously reversed can help traders anticipate potential future reversals, set more strategic entry and exit points, and develop more robust trading strategies.
When to explore it
The Ultra High/Low script is most effective in markets with clear trending or ranging characteristics, where price levels have demonstrated consistent reversal patterns. It works particularly well in liquid markets with sufficient price action, such as major forex pairs, stock indices, and high-volume commodities.
Traders can benefit most from this script during periods of moderate to high market volatility, where price levels are more likely to show meaningful pivots. It is especially useful for traders who rely on technical analysis and want a quick, visual representation of historical price behavior to complement their existing trading strategies.
Keep exploring
What we’ve verified
Access, alerts and repainting behaviour have not been independently verified for this indicator. Check the creator’s current publication and settings.
General descriptions and classifications are recovered research. Verified details above identify the specific checks we have completed. Check the creator’s current publication for later changes.