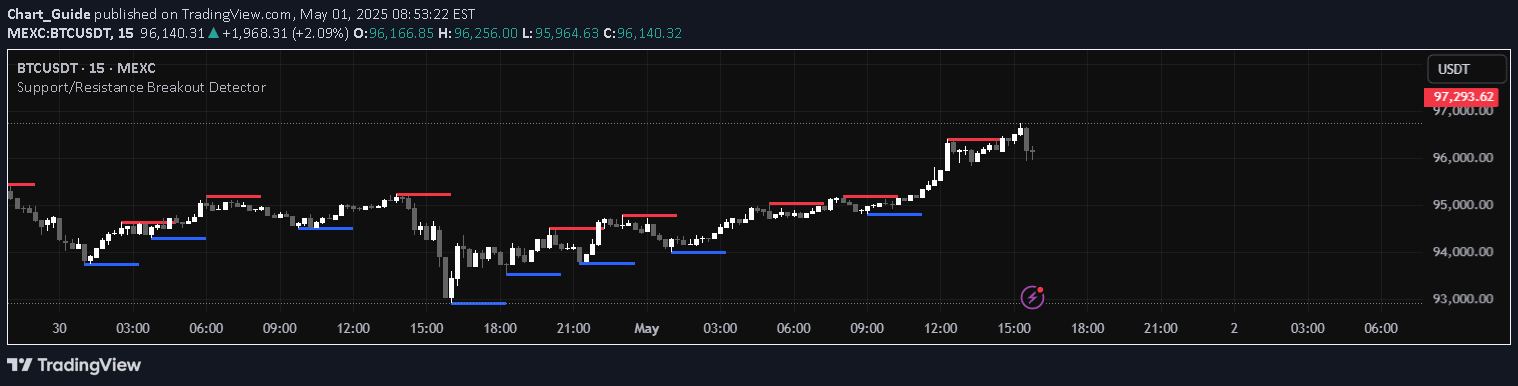
An advanced indicator that automatically detects and classifies support and resistance levels from higher timeframes, providing traders with key market structure insights.
Explore complementary indicator rolesHow it works
The HTF Support & Resistance Zones indicator analyzes multiple higher timeframes including daily, weekly, monthly, and yearly charts to identify critical price levels. It uses an algorithmic approach to detect areas where price has previously bounced, reversed, or consolidated, marking these as potential support and resistance zones.
The indicator then calculates the strength of each zone by counting the number of times price has interacted with that specific level. It automatically categorizes these zones as weak, strong, or very strong based on the touch count, providing traders with a quantitative assessment of each level's significance.
Why it may be useful
Support and resistance zones are crucial for understanding market structure and potential price reaction points. By automatically identifying these levels from higher timeframes, traders gain a strategic overview of where price is likely to encounter obstacles or find potential reversal points.
The indicator's strength classification helps traders prioritize the most significant levels, reducing guesswork and providing a more systematic approach to identifying potential entry, exit, and stop-loss points. This can significantly improve trading decision-making and risk management strategies.
When to explore it
The HTF Support & Resistance Zones indicator is most effective in markets with clear historical price patterns and defined market structure. It works best for traders looking to identify key levels across different timeframes, particularly in liquid and actively traded markets.
Traders should use this indicator in conjunction with other technical analysis tools to confirm signals and validate potential trade setups. It is particularly useful for scalpers and day traders who need quick, reliable insights into potential price reaction zones.
Keep exploring
What we’ve verified
Access, alerts and repainting behaviour have not been independently verified for this indicator. Check the creator’s current publication and settings.
General descriptions and classifications are recovered research. Verified details above identify the specific checks we have completed. Check the creator’s current publication for later changes.