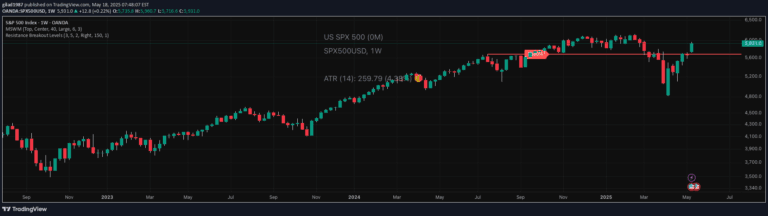
A powerful technical analysis tool that identifies key support and resistance zones using fractal price points to help traders spot potential entry, exit, and reversal opportunities.
Explore complementary indicator rolesHow it works
The Support & Resistance Zones indicator uses pivot points and fractal structure analysis to detect key turning points in price charts. It identifies bull fractals (high pivot points) and bear fractals (low pivot points) based on a configurable 'Switch Zone Period' which determines the sensitivity of zone detection.
Once these pivot points are identified, the indicator creates horizontal rectangular zones extending from these key price levels. The zones are marked with customizable colors and can be adjusted in terms of the number of displayed zones and their horizontal extension, allowing traders to fine-tune the indicator to their specific trading preferences.
Why it may be useful
Support and resistance zones are critical in technical analysis as they provide insights into potential price reversal and consolidation areas. By visualizing these key levels, traders can make more informed decisions about market entry and exit points, reducing the risk of trading against strong market momentum.
The indicator transforms abstract support and resistance concepts into clear, actionable visual information. It helps traders identify potential bounce and breakout opportunities, set strategic stop-loss and take-profit levels, and understand the market's underlying structure and potential future price movements.
When to explore it
The Support & Resistance Zones indicator is most effective in markets with clear trending or ranging behaviors, where price consistently respects established support and resistance levels. It works exceptionally well in timeframes that provide enough price history to establish meaningful pivot points, such as daily, 4-hour, and 1-hour charts.
Traders should use this indicator when seeking to confirm potential trade entries at key market levels, validate trend reversals, or identify high-probability breakout and bounce scenarios. It is particularly useful for traders who employ price action strategies and want a systematic approach to identifying critical market turning points.
Keep exploring
What we’ve verified
Access, alerts and repainting behaviour have not been independently verified for this indicator. Check the creator’s current publication and settings.
General descriptions and classifications are recovered research. Verified details above identify the specific checks we have completed. Check the creator’s current publication for later changes.