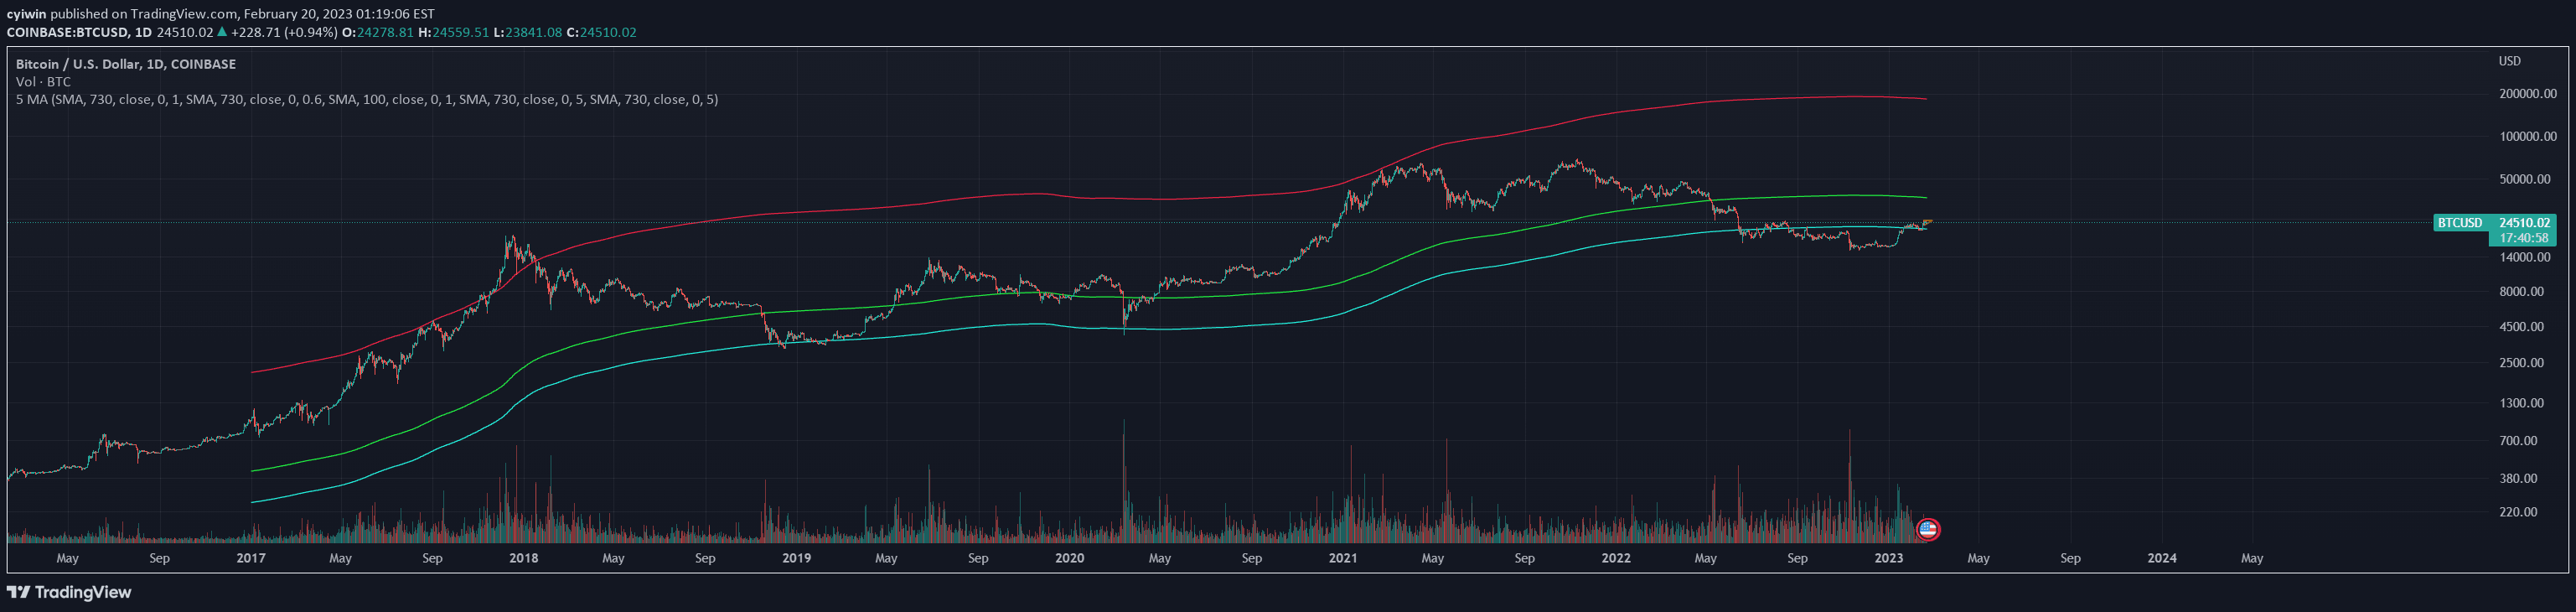
Hull Moving Average (HMA) generates multiple trend-tracking lines across different timeframes, providing a comprehensive view of market momentum and trend direction with reduced lag.
Explore complementary indicator rolesHow it works
The Hull Moving Average calculates a moving average that reduces lag by using weighted calculations and square root transformations. It combines weighted and simple moving averages to create a more responsive trend indicator that adapts quickly to price changes.
By plotting multiple HMA lines with different lengths (10, 20, 50, 100, and 200 periods), traders can simultaneously analyze short, medium, and long-term market trends. Each line represents a different timeframe, allowing for a multi-dimensional view of market momentum and potential trend shifts.
Why it may be useful
The Hull Moving Average provides traders with a more accurate and responsive trend-tracking tool compared to traditional moving averages. Its unique calculation method minimizes lag, enabling traders to identify trend changes and potential reversals more quickly and efficiently.
By offering multiple timeframe perspectives, the HMA helps traders make more informed decisions by providing a comprehensive view of market momentum. The ability to customize colors and analyze different trend lengths makes it a versatile tool for understanding market dynamics across various trading strategies.
When to explore it
The Hull Moving Average is most effective in trending markets where clear directional movement is present. Traders can use it to identify trend direction, strength, and potential reversal points across different timeframes, making it particularly useful for trend-following and trend-reversal strategies.
It works best when combined with other technical indicators to confirm signals and provide additional context. Traders can leverage the HMA for short-term scalping, day trading, and swing trading, adapting its interpretation based on the specific market conditions and their individual trading approach.
Keep exploring
What we’ve verified
Access, alerts and repainting behaviour have not been independently verified for this indicator. Check the creator’s current publication and settings.
General descriptions and classifications are recovered research. Verified details above identify the specific checks we have completed. Check the creator’s current publication for later changes.