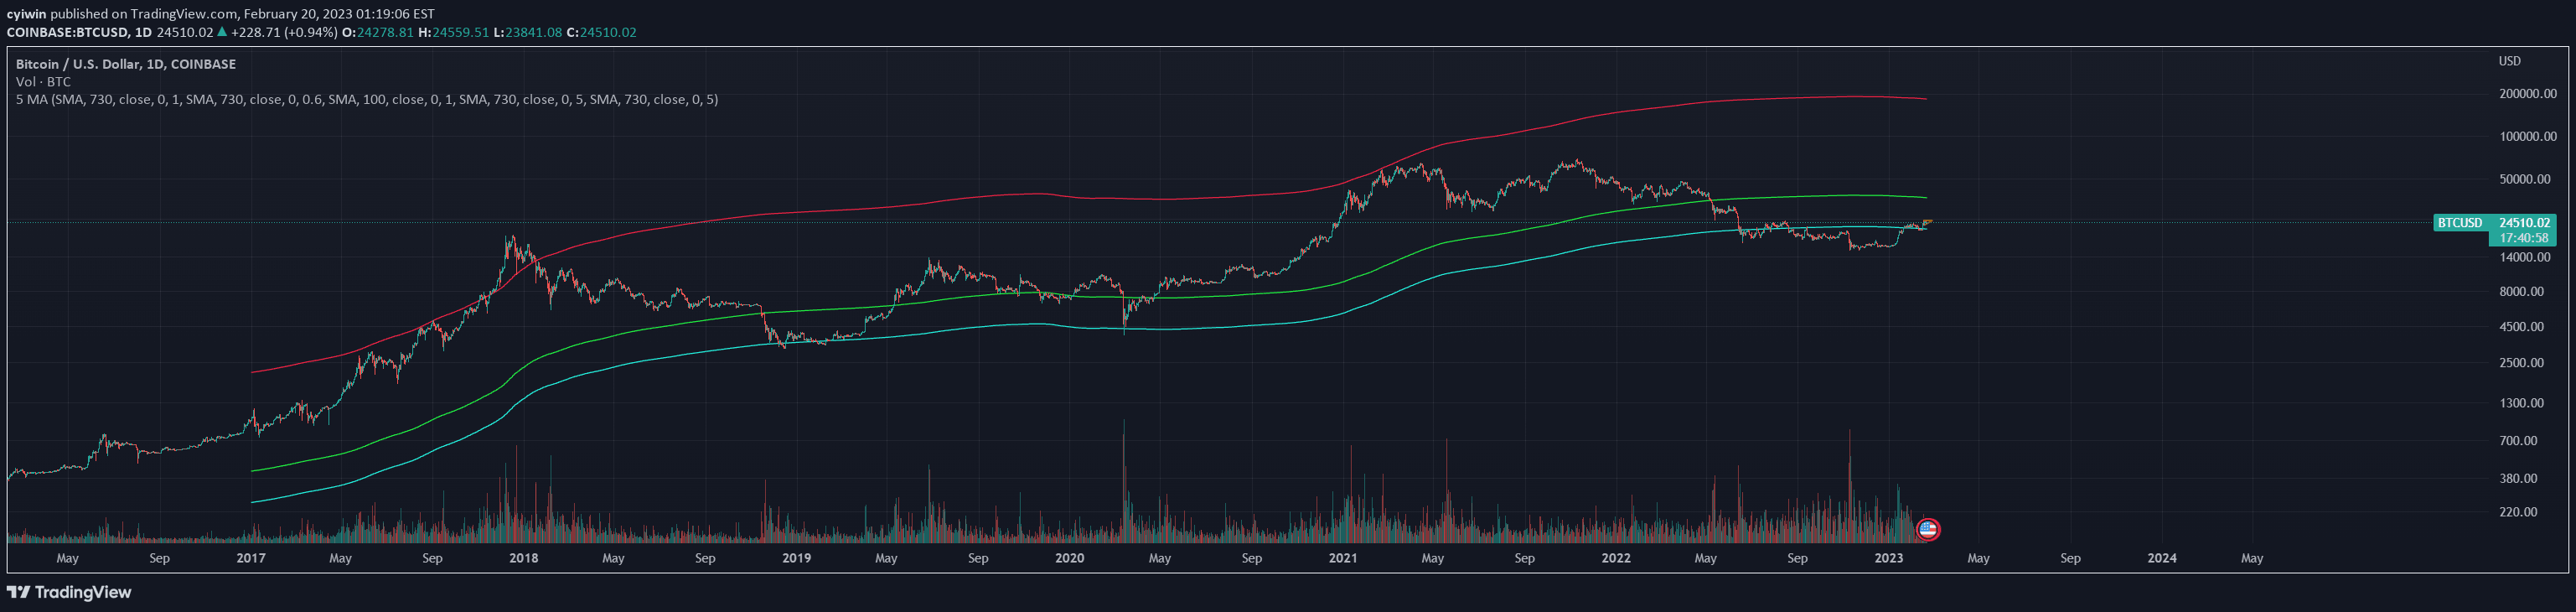
A multi-timeframe moving averages indicator that allows plotting multiple moving average types across daily, weekly, monthly, and intraday charts with customizable settings.
Explore complementary indicator rolesHow it works
The MTF Moving Averages indicator enables traders to plot multiple moving averages simultaneously across different timeframes within a single chart. Users can select up to four moving averages per timeframe, choosing from SMA, EMA, or WMA types and specifying their length and price source. The indicator allows customization of each moving average's color and provides unique features like the daily timeframe's Trend Suite.
For the intraday timeframe, the second moving average is calculated based on the daily timeframe, offering a cross-timeframe analysis perspective. The multiple moving average lines help traders visualize price trends and potential trend changes across various time horizons, providing a comprehensive view of market dynamics.
Why it may be useful
Multi-timeframe moving averages are crucial for traders seeking a comprehensive understanding of market trends and momentum across different time perspectives. By displaying moving averages from daily, weekly, monthly, and intraday charts, traders can identify more robust trend signals and make more informed trading decisions. The ability to customize moving average types, lengths, and colors allows for personalized analysis.
The indicator's flexibility in plotting multiple moving averages helps traders confirm trend strength, detect potential trend reversals, and understand market dynamics from various angles. The Trend Suite feature for the daily timeframe provides additional insight by incorporating low and high source moving averages, further enhancing trend analysis capabilities.
When to explore it
The MTF Moving Averages indicator is most effective when traders want to analyze market trends across multiple timeframes simultaneously. It works exceptionally well during trending markets where clear directional movement is present, helping traders confirm trend strength and potential continuation or reversal points. The indicator is particularly useful for traders who prefer a comprehensive, multi-perspective approach to market analysis.
Traders should utilize this indicator when they need to validate trends across different time horizons, compare trend dynamics between timeframes, and develop more robust trading strategies. It is especially beneficial for traders who want to reduce false signals by cross-referencing trend information from multiple timeframes and gain a more holistic view of market behavior.
Keep exploring
What we’ve verified
Access, alerts and repainting behaviour have not been independently verified for this indicator. Check the creator’s current publication and settings.
General descriptions and classifications are recovered research. Verified details above identify the specific checks we have completed. Check the creator’s current publication for later changes.