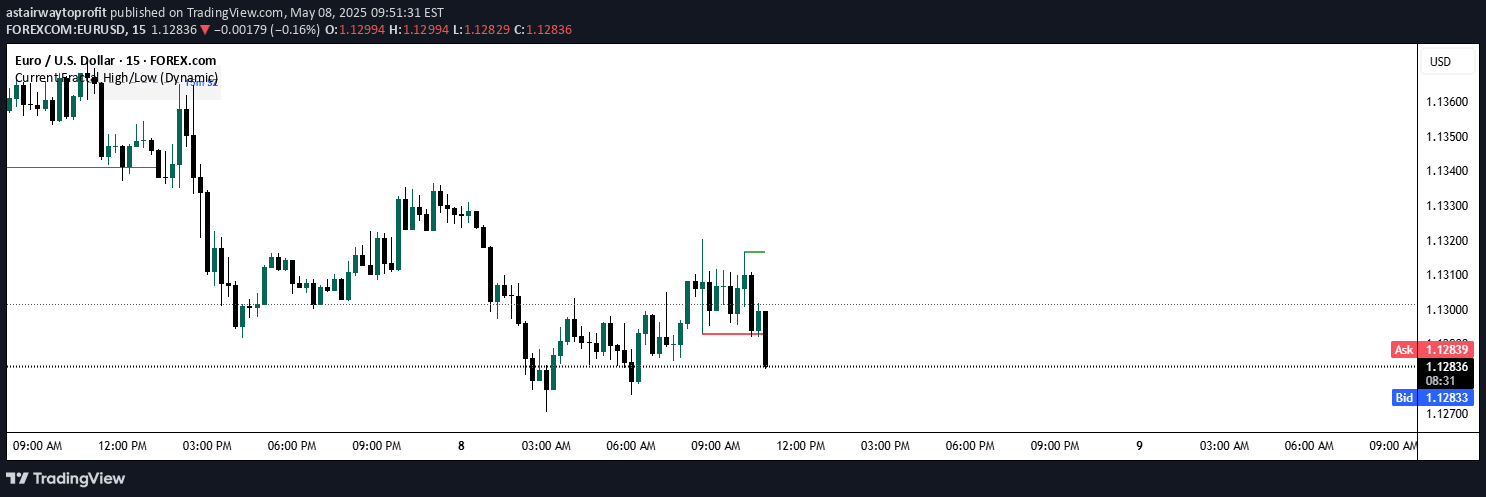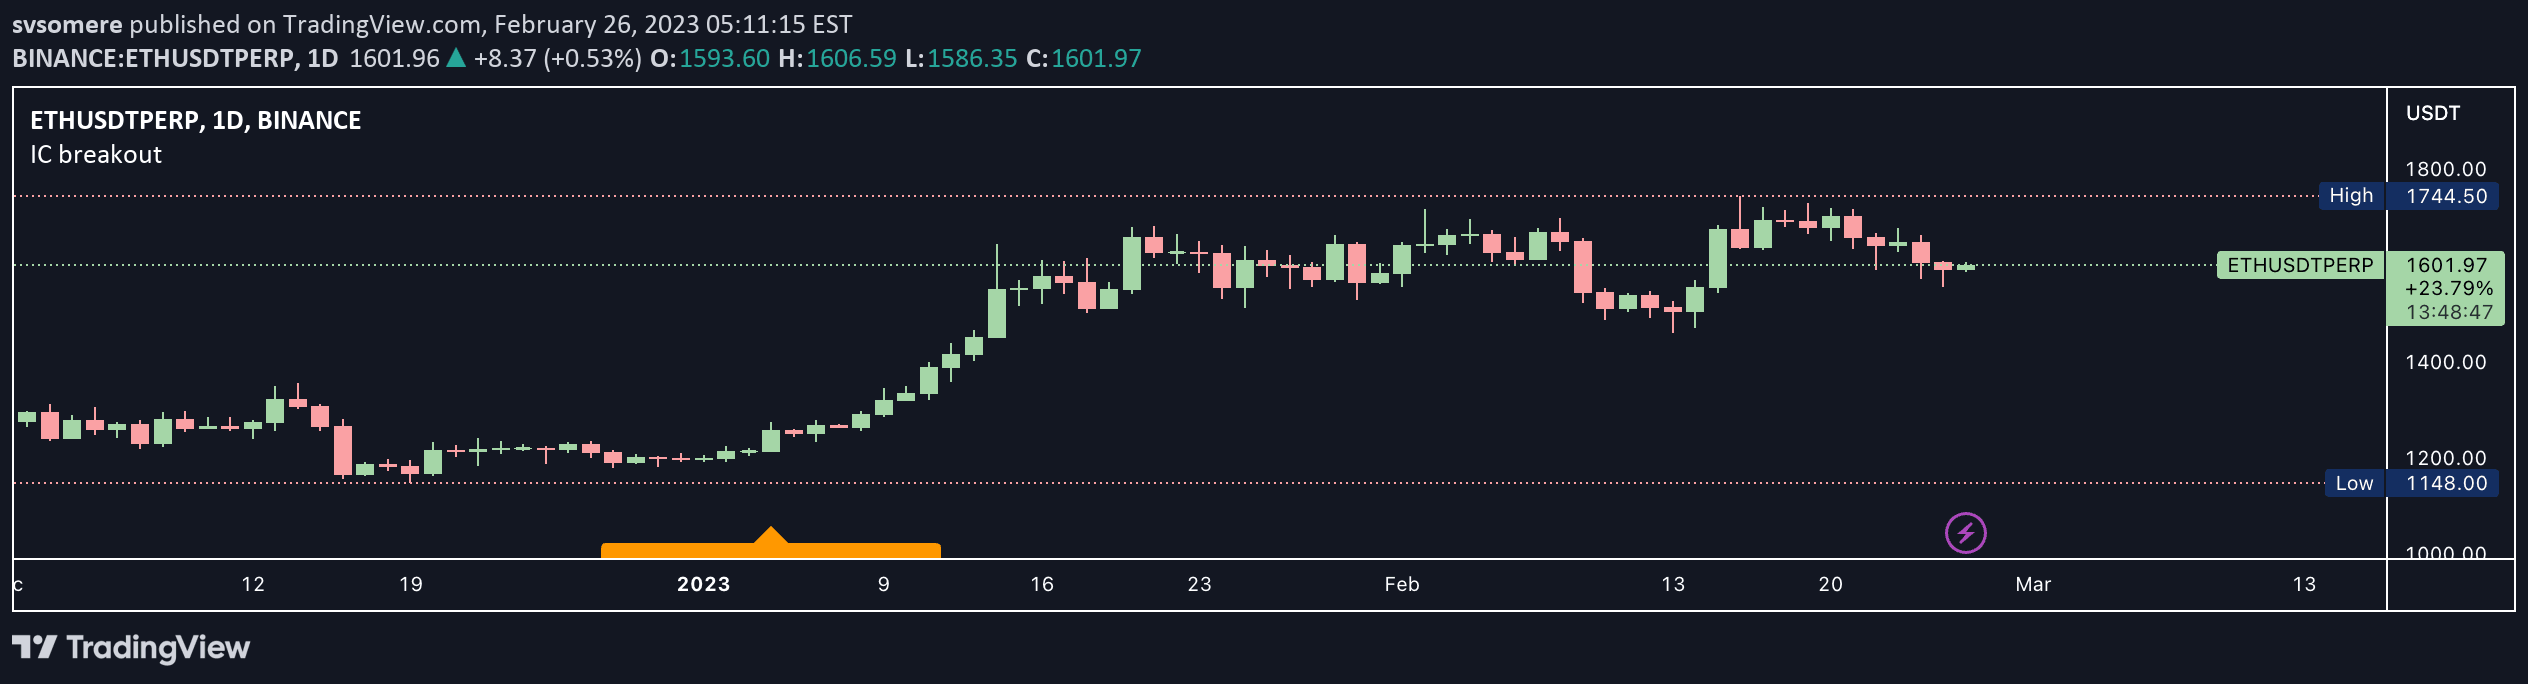
An indicator detecting indecision candles on daily and 4-hour timeframes, providing alerts when the high or low of these candles are breached in subsequent price movements.
Explore complementary indicator rolesHow it works
The indicator identifies indecision candles by analyzing their size and price range, using percentage-based criteria to determine potential market uncertainty. It examines the relationship between the candle's body and total price range to detect moments of trader hesitation.
Once an indecision candle is identified, the indicator tracks subsequent price movements to detect breakouts above or below the candle's high and low points. It generates different types of alerts based on whether the breakout occurs above the high, below the low, or in either direction.
Why it may be useful
Indecision candles represent critical moments of market uncertainty, where traders are evaluating potential trend changes or consolidation periods. By highlighting these moments, traders can better understand market psychology and potential upcoming price movements.
The multiple alert options provide flexibility in trading strategies, allowing traders to customize their approach based on their risk tolerance and trading style. These alerts can serve as early warning signals for potential trend reversals or continuation patterns.
When to explore it
This indicator is most effective in markets experiencing periods of consolidation or potential trend reversal, where price movements are less decisive. It works particularly well on daily and 4-hour timeframes, where longer-term market sentiment can be more clearly observed.
Traders should use this signal in conjunction with other technical analysis tools to confirm potential trade entries or exits. It is especially useful in volatile markets where quick identification of market uncertainty can provide a significant trading advantage.
Keep exploring
What we’ve verified
Access, alerts and repainting behaviour have not been independently verified for this indicator. Check the creator’s current publication and settings.
General descriptions and classifications are recovered research. Verified details above identify the specific checks we have completed. Check the creator’s current publication for later changes.