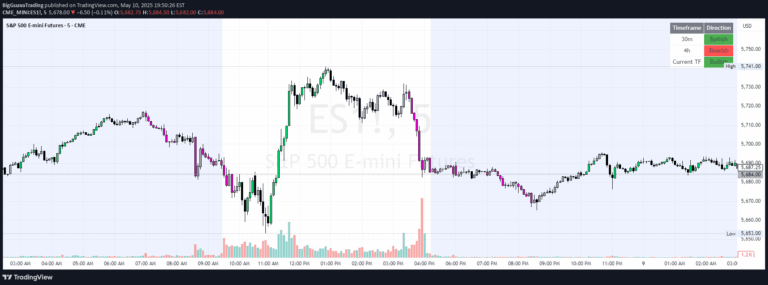
A dynamic fractal indicator that tracks the most recent confirmed high and low points, helping traders identify key market turning points and structural shifts across different timeframes.
Explore complementary indicator rolesHow it works
The Fractal High and Low indicator works by analyzing price action patterns around specific pivot points. It identifies fractal formations by comparing a central bar with a specified number of bars to its left and right, determining whether a particular bar represents a high or low point in the market structure.
Once a fractal is confirmed, the indicator automatically draws color-coded lines and labels on the chart. Green lines with 'FH' mark the most recent Fractal High, while red lines with 'FL' indicate the most recent Fractal Low. These lines extend from the confirmation bar to the current candle, providing a dynamic visual representation of market structure.
Why it may be useful
Fractals are crucial for traders because they help identify key turning points in market dynamics. By marking significant highs and lows, the indicator provides traders with a clear visual representation of market structure, which can be essential for understanding potential trend reversals and support/resistance levels.
The dynamic nature of this indicator allows traders to quickly recognize important price action patterns without manual intervention. It removes old lines automatically, ensuring a clean and uncluttered chart that focuses on the most recent and relevant market information.
When to explore it
The Fractal High and Low indicator is most effective in markets with clear directional movements and identifiable swing points. It works particularly well in timeframes ranging from intraday to swing trading, where identifying key market structure is crucial for making trading decisions.
Traders can use this indicator to support liquidity and breakout strategies, helping them identify potential entry and exit points. It is especially useful when combined with other technical analysis tools to confirm market trends, support levels, and potential price reversals.
Keep exploring
What we’ve verified
Access, alerts and repainting behaviour have not been independently verified for this indicator. Check the creator’s current publication and settings.
General descriptions and classifications are recovered research. Verified details above identify the specific checks we have completed. Check the creator’s current publication for later changes.