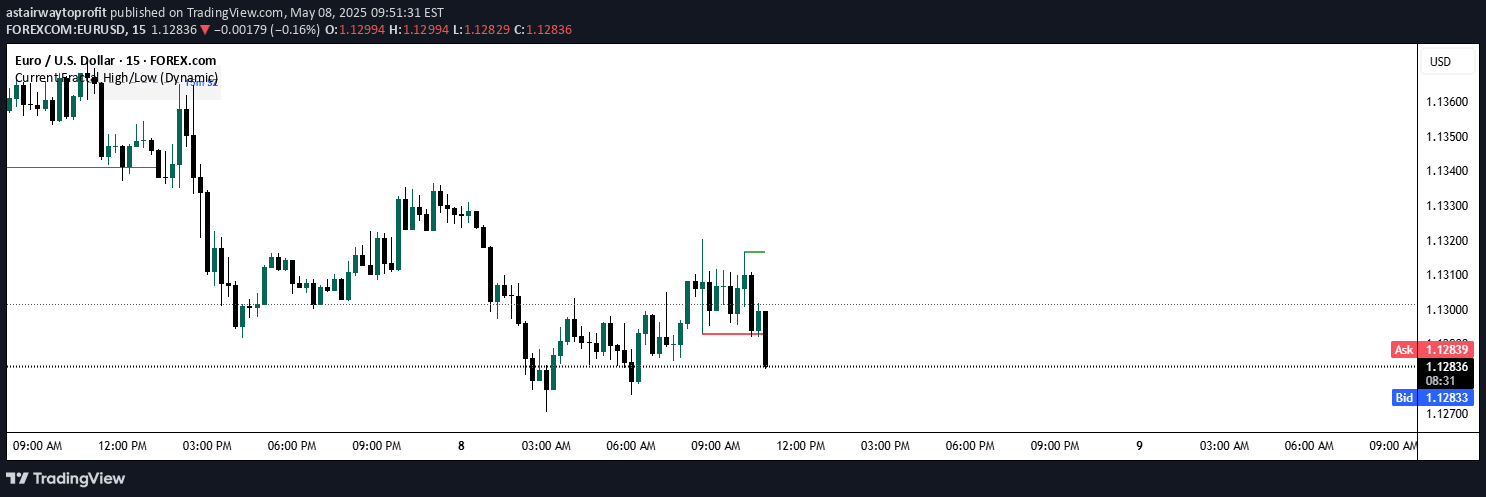
A trading indicator that identifies key fractal points on price charts, marking potential reversal zones and dynamic support/resistance levels to enhance market analysis and trading decisions.
Explore complementary indicator rolesHow it works
The fractal indicator uses a 5-bar pattern to detect top and bottom fractal points on a price chart. A top fractal forms when the middle bar has a higher high compared to the two bars on either side, while a bottom fractal forms when the middle bar has a lower low than the surrounding bars.
The indicator automatically plots these fractal points using triangular shapes, with top fractals displayed as downward triangles and bottom fractals shown as upward triangles. It can also filter out non-pristine fractals based on custom conditions, reducing false signals and improving the overall accuracy of the detection process.
Why it may be useful
Fractal indicators provide traders with critical insights into potential market reversal points and dynamic support/resistance levels. By identifying key price patterns, traders can make more informed decisions about market entry and exit points, helping to improve overall trading strategy and risk management.
The visual representation of fractal points allows traders to quickly recognize significant price levels and potential trend changes. This helps in developing more precise trading strategies, reducing emotional decision-making, and providing a structured approach to market analysis across different timeframes and trading styles.
When to explore it
The fractal indicator is most effective in markets with clear price patterns and defined trend movements. It works particularly well in trending markets where price tends to respect support and resistance levels, making it valuable for both trend-following and reversal trading strategies.
Traders can apply this indicator across various timeframes, from short-term scalping to longer-term swing trading. It is especially useful during periods of market consolidation or when identifying potential breakout points, helping traders spot critical price levels and potential trend reversals with greater precision.
Keep exploring
What we’ve verified
Access, alerts and repainting behaviour have not been independently verified for this indicator. Check the creator’s current publication and settings.
General descriptions and classifications are recovered research. Verified details above identify the specific checks we have completed. Check the creator’s current publication for later changes.