
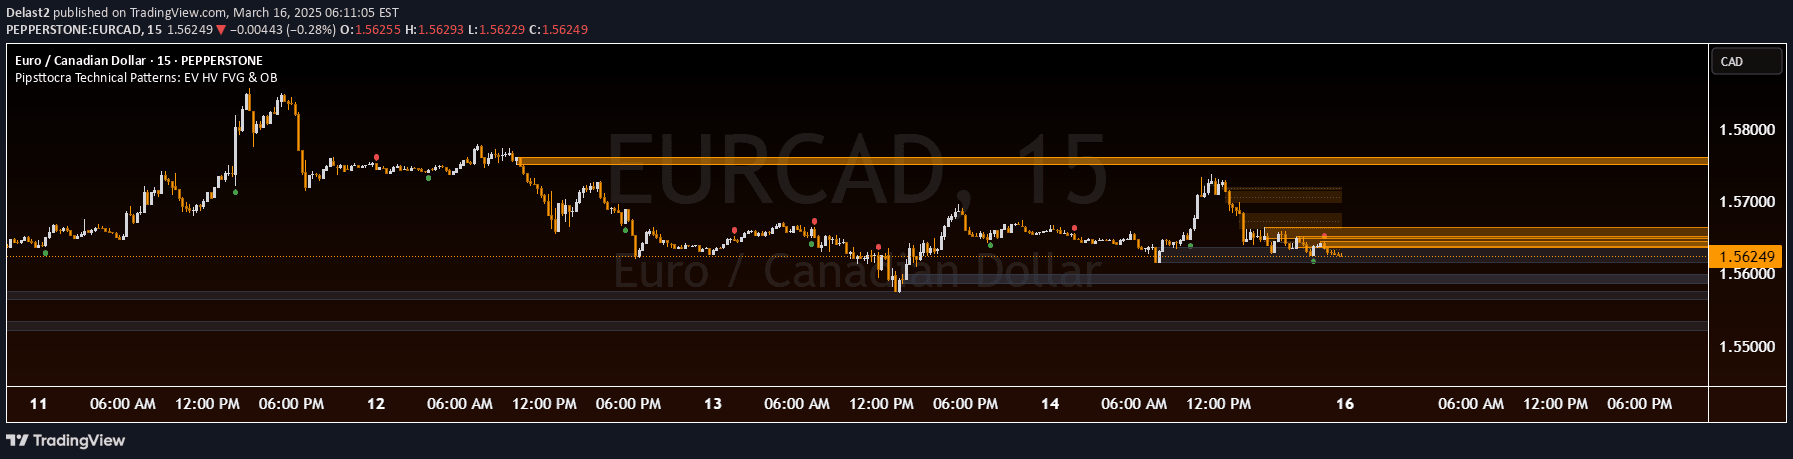
A comprehensive technical analysis tool that identifies key market structures like Fair Value Gaps, Order Blocks, and candlestick patterns to help traders spot high-probability trading opportunities.
Explore complementary indicator rolesHow it works
Pipstocrat Technical Patterns uses advanced algorithmic scanning to detect and visualize specific market structures across price charts. It automatically identifies Fair Value Gaps, Order Blocks, and candlestick patterns by analyzing price action, volume, and geometric relationships between consecutive candles.
The tool generates visual markers like colored boxes, rectangles, and custom shapes to highlight these patterns. It also adds centerline markers and extends patterns to provide traders with clear visual cues about potential trading opportunities and market dynamics.
Why it may be useful
Technical analysis tools like Pipstocrat help traders understand market structure and make more informed trading decisions by revealing hidden patterns and potential price movements. By consolidating multiple technical analysis concepts into a single indicator, traders can quickly assess market conditions and identify high-probability trading setups.
The comprehensive approach reduces the cognitive load of analyzing charts manually and provides a systematic framework for interpreting market behavior. It transforms complex technical analysis concepts into easily digestible visual information, enabling traders to recognize opportunities more efficiently.
When to explore it
Pipstocrat Technical Patterns is most effective in markets with clear price action and sufficient trading volume, such as forex, futures, and liquid stock markets. It works best on timeframes ranging from 1-minute to daily charts, providing valuable insights for scalpers, day traders, and swing traders.
Traders should use this tool in conjunction with other technical and fundamental analysis methods to confirm signals and manage risk. It is particularly useful during trending market conditions and when seeking precise entry and exit points based on market structure and candlestick formations.
Keep exploring
What we’ve verified
Access, alerts and repainting behaviour have not been independently verified for this indicator. Check the creator’s current publication and settings.
General descriptions and classifications are recovered research. Verified details above identify the specific checks we have completed. Check the creator’s current publication for later changes.


