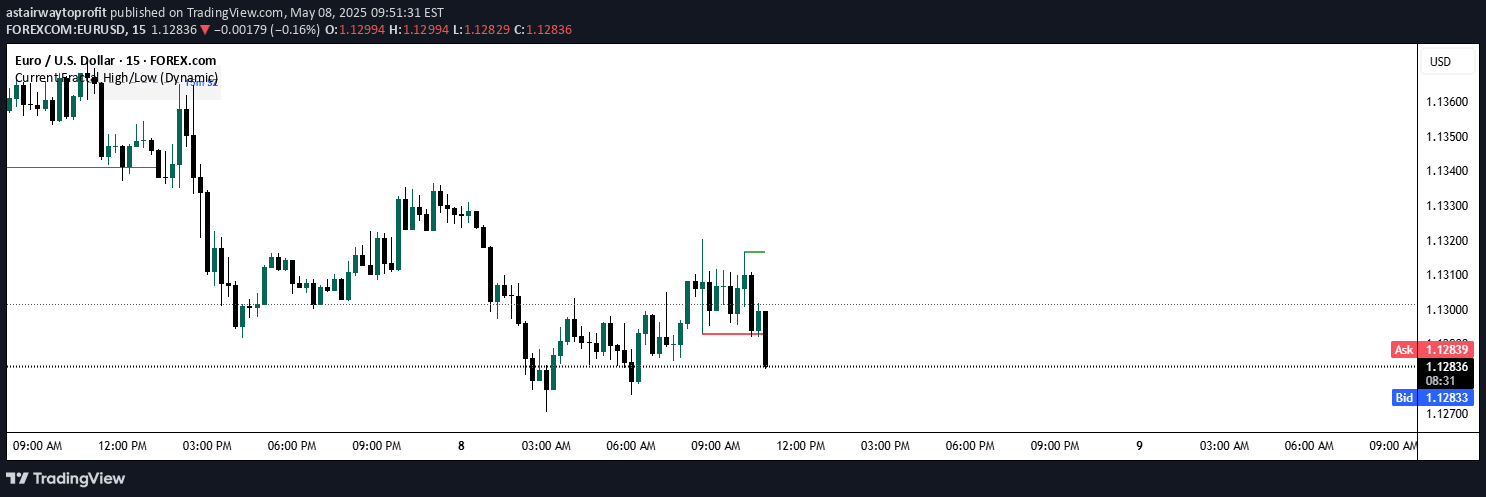
Fractal Pivots are a unique technical analysis method using Bill Williams' Fractal Theory to identify repetitive price patterns and generate pivot lines across different timeframes.
Explore complementary indicator rolesHow it works
The Fractal Pivots indicator identifies and tracks specific price patterns across different timeframes by analyzing historical fractal formations. It looks for repetitive price behaviors within a user-defined time period, marking key pivot points based on these fractal patterns.
By remembering fractals from previous periods, the indicator generates pivot lines that can help traders anticipate potential support and resistance levels. For example, on an hourly chart with a weekly pivot setting, the script will highlight fractals from the previous week and use them to draw pivot lines for the current trading period.
Why it may be useful
Fractal Pivots provide traders with a unique perspective on market dynamics by revealing recurring price patterns based on the Chaos Theory. This approach helps traders understand underlying market structures and potential future price movements beyond traditional technical analysis methods.
By identifying repetitive price behaviors, traders can gain insights into market psychology and develop more strategic entry and exit points. The indicator's flexibility across different timeframes makes it a versatile tool for various trading styles and market conditions.
When to explore it
Fractal Pivots work best in markets with consistent and repetitive price patterns, such as forex, futures, and certain stock indices. Traders should use this indicator when seeking to identify potential support and resistance levels based on historical price behaviors.
The indicator is particularly useful during trending markets and when looking for confirmation of potential trend reversals or continuation patterns. Optimal results can be achieved by experimenting with different fractal lengths and timeframes to match specific trading instruments and market conditions.
Keep exploring
What we’ve verified
Access, alerts and repainting behaviour have not been independently verified for this indicator. Check the creator’s current publication and settings.
General descriptions and classifications are recovered research. Verified details above identify the specific checks we have completed. Check the creator’s current publication for later changes.