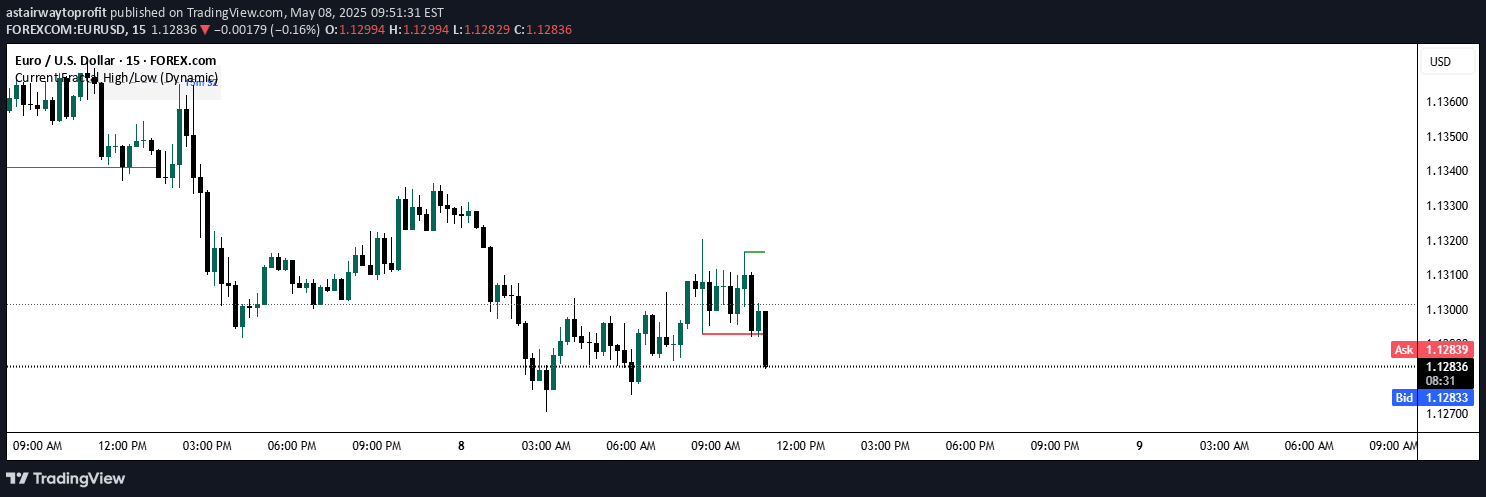
A fractal indicator that identifies local high and low points on price charts, helping traders spot potential support, resistance, and reversal zones through five-candle pattern recognition.
Explore complementary indicator rolesHow it works
The fractal indicator operates by analyzing a sequence of five consecutive candles to identify significant price extremes. In a five-candle sequence, a fractal high is determined when the middle candle has the highest price compared to the two candles on its left and right sides. Similarly, a fractal low is identified when the middle candle represents the lowest price point in the same five-candle sequence.
Once these fractal points are detected, the indicator marks them with specific visual signals: red dots for fractal highs and green dots for fractal lows. These markings are dynamically updated with each new candle, providing real-time insights into potential market turning points and key price levels.
Why it may be useful
Fractal indicators are crucial for traders seeking to understand market structure and potential price reversals. By highlighting key extremes, these indicators help traders identify critical support and resistance levels that might not be immediately apparent through visual inspection.
The visual representation of fractals allows for quick recognition of potential trend changes and market sentiment shifts. Moreover, fractals provide a systematic approach to recognizing market turning points, which can be instrumental in developing trading strategies. Traders can use these points to make more informed decisions about entry and exit points, risk management, and overall market analysis.
When to explore it
Fractal indicators are most effective in markets with clear trend movements and discernible price patterns. They work exceptionally well in trading environments that experience regular price oscillations, such as cryptocurrency, forex, and stock markets. Traders can benefit from using fractals in both trending and ranging market conditions, as they provide insights into potential reversal zones.
The indicator is particularly useful when combined with other technical analysis tools like trend lines, moving averages, or momentum indicators. By confirming signals across multiple indicators, traders can increase the probability of successful trade entries and exits, making fractals a valuable component of a comprehensive trading strategy.
Keep exploring
What we’ve verified
Access, alerts and repainting behaviour have not been independently verified for this indicator. Check the creator’s current publication and settings.
General descriptions and classifications are recovered research. Verified details above identify the specific checks we have completed. Check the creator’s current publication for later changes.