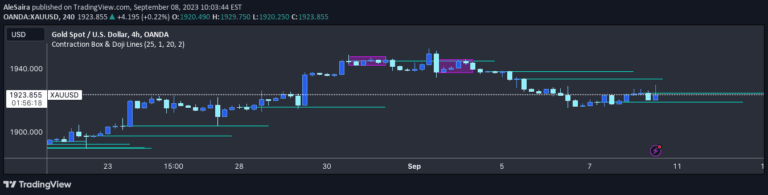
A fractal detection system that identifies key price turning points by analyzing candle body highs and lows, marking significant top and bottom price levels with visual indicators.
Explore complementary indicator rolesHow it works
The fractal detection script analyzes price candles to identify potential turning points in market trends by comparing the body highs and lows of a central candle with surrounding candles. It determines top fractals when the central candle has a higher body high than neighboring candles, and bottom fractals when the central candle has a lower body low than surrounding candles.
Users can customize the number of candles to check on each side of the central bar and set the number of fractals to remember and display. The system ensures no duplicate fractals are marked by checking for unique high and low levels, providing a dynamic and adaptable method for tracking significant price levels.
Why it may be useful
Fractal detection helps traders identify critical price levels where potential trend reversals or continuation patterns might occur, offering valuable insights into market structure and potential trading opportunities. By highlighting key fractal points, traders can make more informed decisions about entry and exit points, stop-loss placement, and overall market sentiment.
The visual indicators, such as red downward triangles for top fractals and green upward triangles for bottom fractals, provide an intuitive and immediate way to recognize important price levels. This method allows traders to quickly understand market dynamics and potential turning points without complex technical analysis.
When to explore it
Fractal detection works best in markets with clear price movements and defined trends, where price action shows distinct highs and lows that can indicate potential trend reversals or continuations. It is particularly effective in volatile markets where price levels can quickly change and traders need to adapt their strategies rapidly.
The indicator is most useful for traders who rely on price action analysis and want to identify key support and resistance levels dynamically. It can be applied across various timeframes, from scalping to swing trading, making it a versatile tool for traders seeking to understand market structure and potential trading opportunities.
Keep exploring
What we’ve verified
Access, alerts and repainting behaviour have not been independently verified for this indicator. Check the creator’s current publication and settings.
General descriptions and classifications are recovered research. Verified details above identify the specific checks we have completed. Check the creator’s current publication for later changes.