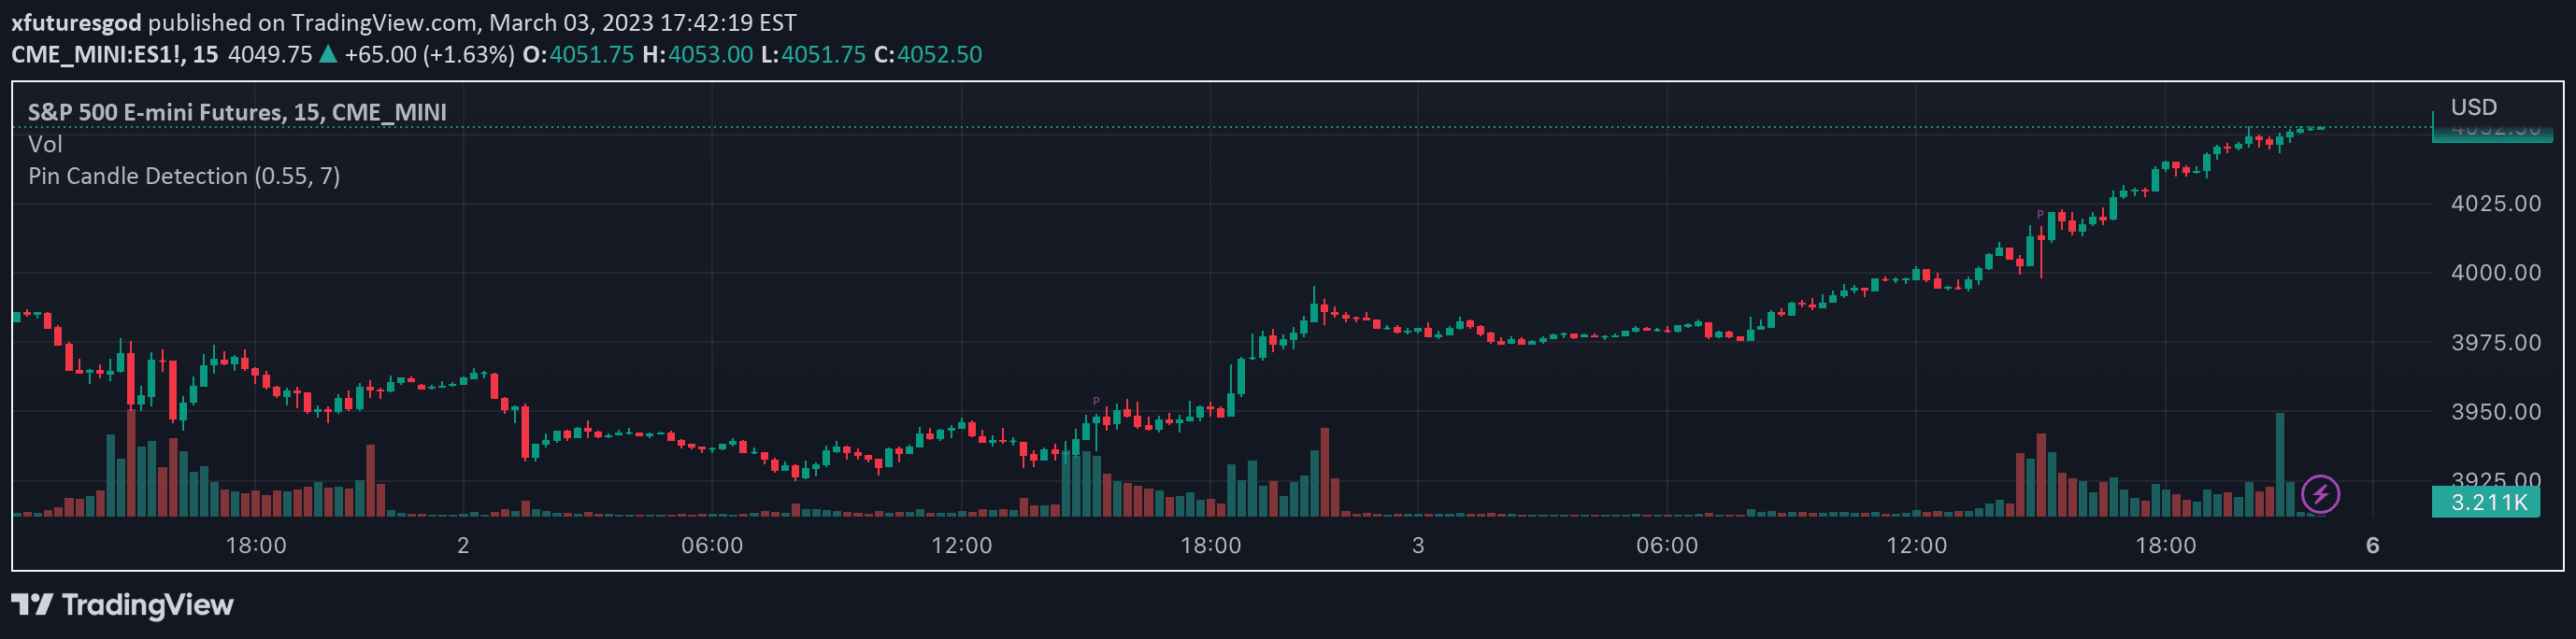
A Pine Script indicator that identifies candle patterns and highlights potential buying and selling levels by analyzing price action, wicks, and breakout zones.
Explore complementary indicator rolesHow it works
The indicator analyzes the current candle and its two immediate predecessors to identify potential trading levels. It examines candle wicks and price breaks to detect areas of buying and selling pressure, focusing on how market participants interact with specific price zones.
By tracking the characteristics of candle wicks and subsequent price movements, the script creates horizontal lines that extend to the right side of the chart. These lines visually represent key levels where price has previously shown significant interaction, helping traders understand potential support and resistance zones.
Why it may be useful
This indicator provides traders with a visual representation of market dynamics, revealing where buying and selling pressures intersect. By highlighting breakout and retest levels, it offers insights into potential trend reversals and areas of market consolidation, which can be crucial for making informed trading decisions.
The tool's ability to draw extended horizontal lines helps traders recognize recurring price patterns and understand the frequency of price retests in specific zones. This visual approach makes complex price action analysis more accessible and intuitive, allowing traders to quickly identify potential entry and exit points.
When to explore it
The indicator is most effective in markets with clear price action and distinct candle formations, such as forex, stocks, and cryptocurrency trading. It works best when combined with other technical analysis tools to confirm potential trading signals and provide additional context to price movements.
Traders should utilize this indicator during periods of market volatility and when looking to identify key support and resistance levels. It is particularly useful for analyzing shorter timeframes where price action patterns are more pronounced and can provide quick insights into potential trading opportunities.
Keep exploring
What we’ve verified
Access, alerts and repainting behaviour have not been independently verified for this indicator. Check the creator’s current publication and settings.
General descriptions and classifications are recovered research. Verified details above identify the specific checks we have completed. Check the creator’s current publication for later changes.