Linear Regression Oscillator [ChartPrime]
A custom indicator using linear regression to analyze closing prices, helping traders identify market trends, mean reversion, and potential overbought or oversold conditions across different timeframes.
Explore 11,183 indicators. Filter beyond the obvious.
Discover the tools that fit the way you trade.
11,183 tools to explore
A custom indicator using linear regression to analyze closing prices, helping traders identify market trends, mean reversion, and potential overbought or oversold conditions across different timeframes.
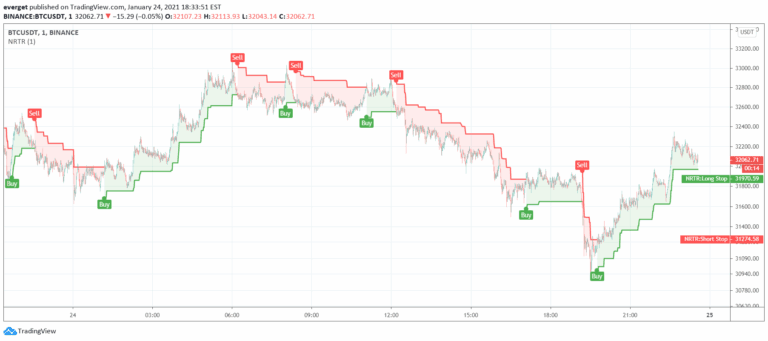
Nick Rypock Trend Reversal (NRTR) is a dynamic price channel indicator that tracks trend direction by measuring price extremes and percentage deviation from peak or bottom.
A comprehensive market sentiment indicator that synthesizes multiple technical analysis techniques into a single value, providing insights into market direction, momentum, and potential trend reversals.
A trading indicator that identifies untapped liquidity levels across different timeframes, helping traders understand potential price movement magnets and liquidity pools in the market.
Volume Order Blocks is a powerful trading indicator that identifies significant order blocks using EMA crossovers, volume analysis, and price structure to highlight key supply and demand zones.
A trading signal that identifies price gaps at market extremes, analyzing the likelihood of price reversal and market rebalancing through statistical mitigation probability.
A technical indicator that highlights previous day's high and low points, uses daily and weekly separators to create a clean chart that helps traders understand potential market direction.
A trading indicator that highlights previous market highs and lows, creating customizable support and resistance zones across multiple timeframes to help traders identify potential price reaction levels.
The Bollinger Band Width Percentile measures relative volatility by calculating the percentage of historical periods where Bollinger Band width was narrower than the current period.
A comprehensive trading toolkit that combines momentum, volatility, and price action analysis to provide insights into market trends, momentum, and potential reversals.
The Fear & Greed Index measures market sentiment by analyzing seven key market indicators, providing traders with insights into potential market behavior and emotional extremes.
Faytterro Bands are a channel indicator similar to Bollinger Bands, using weighted moving averages and standard deviations to identify market price zones.
Likes, views, and comments are historical TradingView snapshots. They describe attention, not trading performance.