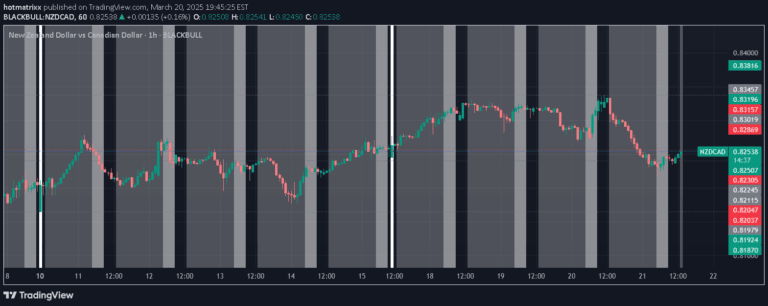
An ICT trading technique focusing on identifying swing lows and highs during the New York market opening, providing potential scalping opportunities for traders.
Explore complementary indicator rolesHow it works
The ICT swing low and high technique involves carefully observing price action during the New York market opening to identify potential entry points. Traders watch for specific price movements and market structure around the market open, looking for precise swing points that indicate potential trading opportunities.
By analyzing the initial market movements, traders can detect potential reversal zones or momentum shifts that might signal profitable scalping entries. This method requires keen observation of order flow, market structure, and quick decision-making to capitalize on short-term price fluctuations.
Why it may be useful
The ICT swing technique provides traders with a structured approach to navigating the often volatile New York market opening. By focusing on specific price patterns and market structure, traders can develop a more disciplined and systematic approach to identifying high-probability trading opportunities.
This method helps traders minimize emotional decision-making and instead rely on a more methodical analysis of market dynamics. It offers a framework for understanding market microstructure and potential short-term trading opportunities during a typically active market period.
When to explore it
The ICT swing technique is most effective during the New York market opening, when liquidity and volatility are typically at their highest. Traders should apply this method when they are looking for short-term, precise entry points with potential for quick profits.
It is particularly useful for traders who are comfortable with fast-paced trading environments and have a solid understanding of market structure and order flow. The technique works best in markets with clear, identifiable swing points and during periods of active trading.
Keep exploring
What we’ve verified
Access, alerts and repainting behaviour have not been independently verified for this indicator. Check the creator’s current publication and settings.
General descriptions and classifications are recovered research. Verified details above identify the specific checks we have completed. Check the creator’s current publication for later changes.