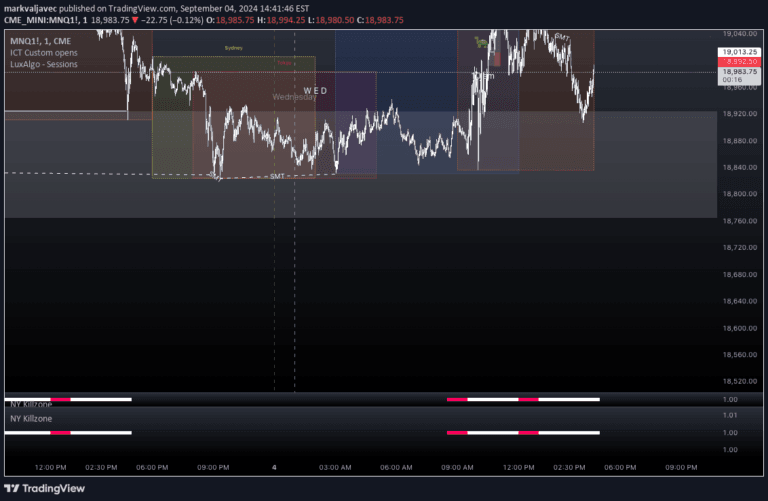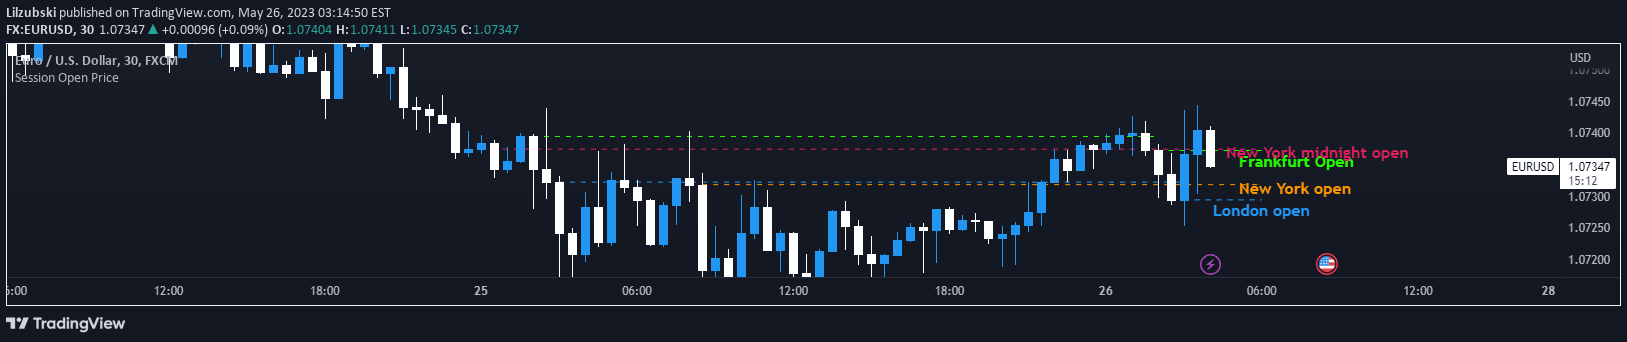
An indicator displaying multiple market session open prices across different time zones, helping traders identify potential entry points and market bias based on price positioning.
Explore complementary indicator rolesHow it works
The ICT kill zones indicator plots open prices from different global market sessions, including Midnight New York, Frankfurt, London, and 8:30 AM New York times. Each session's open price is represented by a colored dash line, allowing traders to quickly visualize the market's opening levels.
Traders use these open prices to determine market bias and potential trading directions. When the current price is above the opening price, traders focus on selling opportunities, and when the price is below the opening price, they look for buying opportunities.
Why it may be useful
The indicator provides traders with critical market session information, helping them understand the underlying market structure and potential directional bias. By tracking multiple global market opens, traders can gain insights into potential price movements and make more informed trading decisions.
Understanding session open prices allows traders to align their strategies with the market's current sentiment, reducing the likelihood of trading against the prevalent market momentum and improving overall trade probability.
When to explore it
The indicator is most effective during active market hours when multiple global sessions are overlapping, providing the most comprehensive view of market dynamics. Traders should use this signal when seeking clear reference points for potential trade entries and market sentiment analysis.
It is particularly useful for traders focusing on short-term trades, such as scalping and day trading, where quick and precise market understanding is crucial. The indicator works best when combined with additional confirmation signals and robust entry strategies.
Keep exploring
What we’ve verified
Access, alerts and repainting behaviour have not been independently verified for this indicator. Check the creator’s current publication and settings.
General descriptions and classifications are recovered research. Verified details above identify the specific checks we have completed. Check the creator’s current publication for later changes.