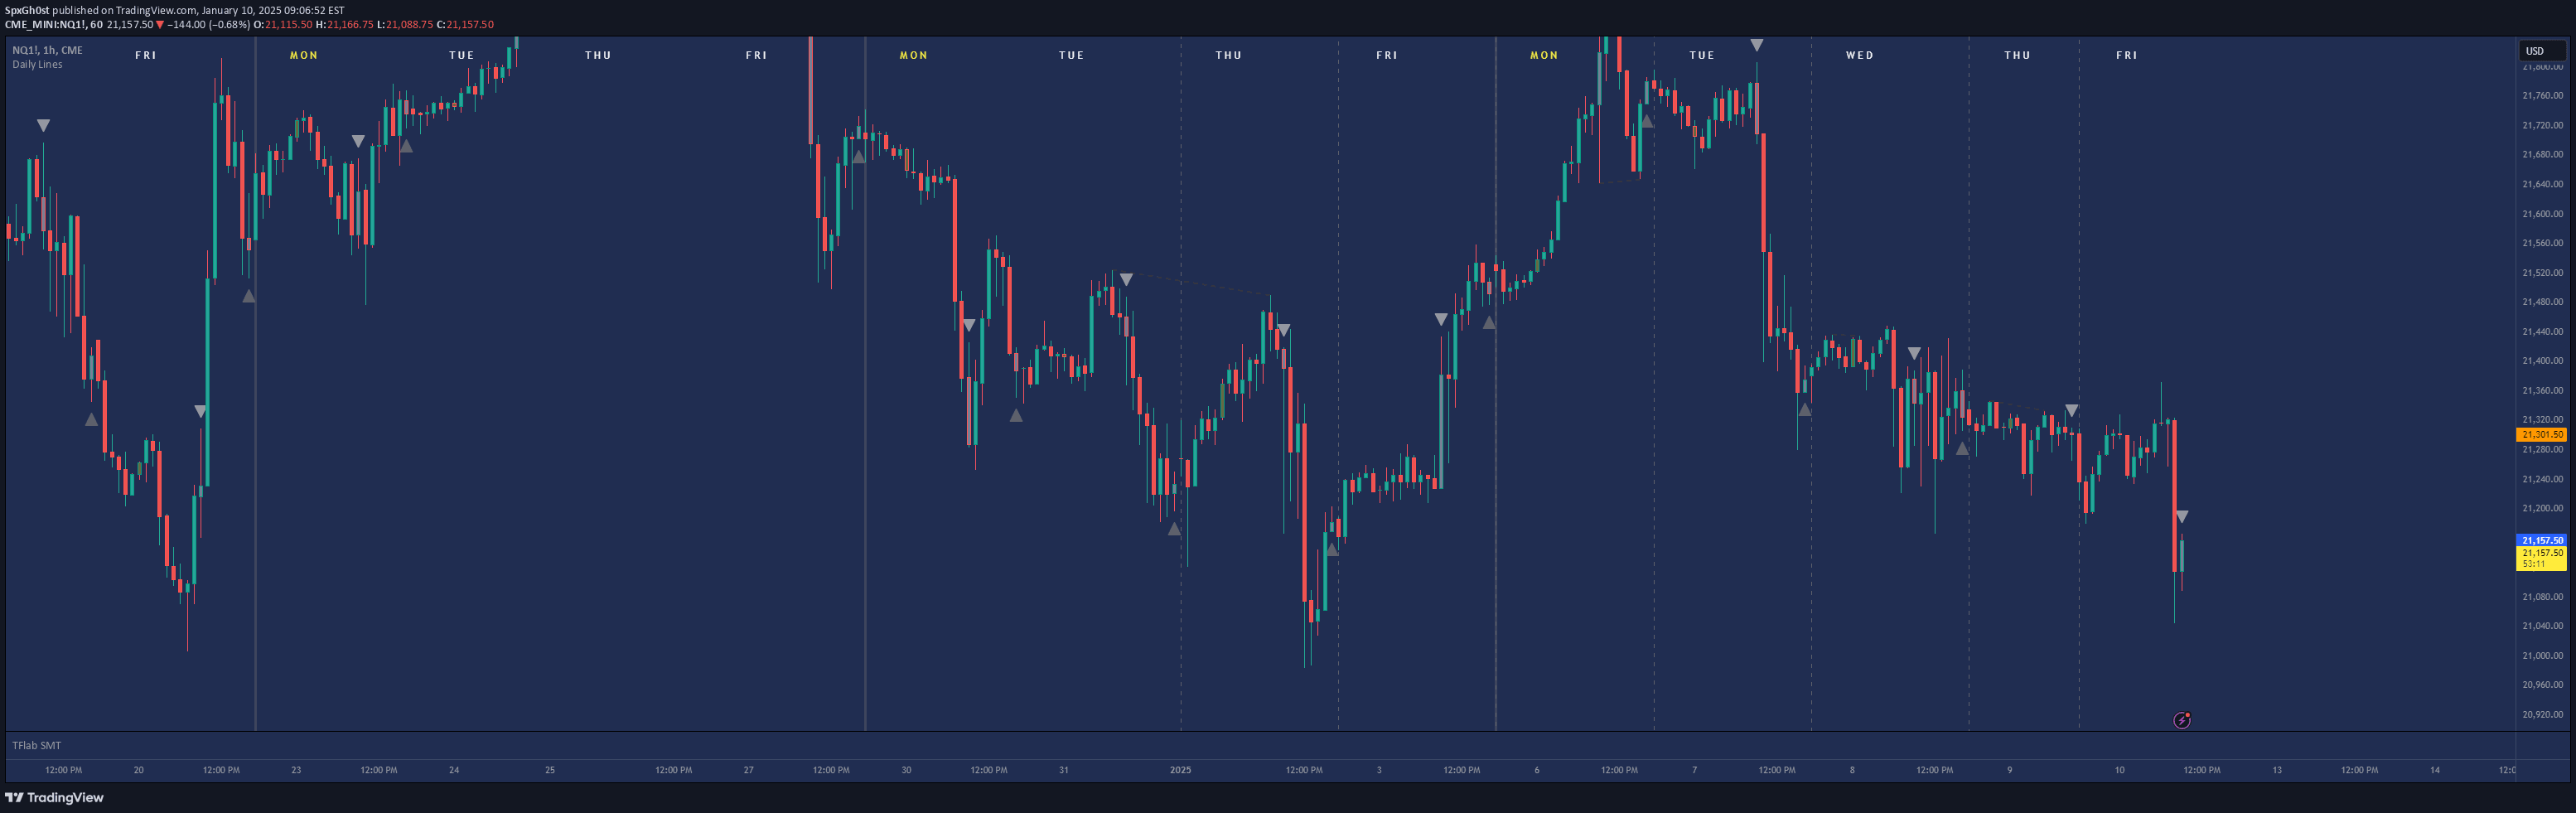
An ICT-based indicator that plots multiple gap and volume imbalance levels across different timeframes, helping traders identify potential price magnets and trading opportunities.
Explore complementary indicator rolesHow it works
The indicator calculates and plots five distinct market gap and volume areas: Daily Volume Imbalances, New Week Opening Gaps (NWOG), New Day Opening Gaps (NDOG), New Opening Gaps, and a 0930 Opening Line. These levels are derived from specific price points and time ranges, typically between market close and open times.
Each plotted area represents potential price interaction zones, with volume imbalances identified by comparing close and open prices of candles. The indicator allows customization of colors and display settings, enabling traders to visualize these critical market structure points across different timeframes and highlight potential price magnetism.
Why it may be useful
These gap and volume imbalance levels provide traders with critical insights into market structure and potential price movement dynamics. By identifying areas where price might naturally gravitate or potentially reverse, traders can make more informed decisions about entry, exit, and risk management.
The indicator's multi-layered approach helps traders understand market microstructure, revealing hidden liquidity zones and potential trading opportunities that might not be immediately visible through traditional price action analysis. This approach supports more strategic and informed trading decisions across different market conditions.
When to explore it
The indicator is most effective for intraday and short-term trading strategies, particularly in liquid markets with clear opening and closing times. Traders can utilize these levels during active market hours, especially around market open and during periods of potential price consolidation or transition.
It works best when combined with other technical analysis tools and when traders have a solid understanding of market structure and volume dynamics. The indicator is particularly useful for traders focusing on futures, forex, and stock index markets with well-defined trading sessions.
Keep exploring
What we’ve verified
Access, alerts and repainting behaviour have not been independently verified for this indicator. Check the creator’s current publication and settings.
General descriptions and classifications are recovered research. Verified details above identify the specific checks we have completed. Check the creator’s current publication for later changes.