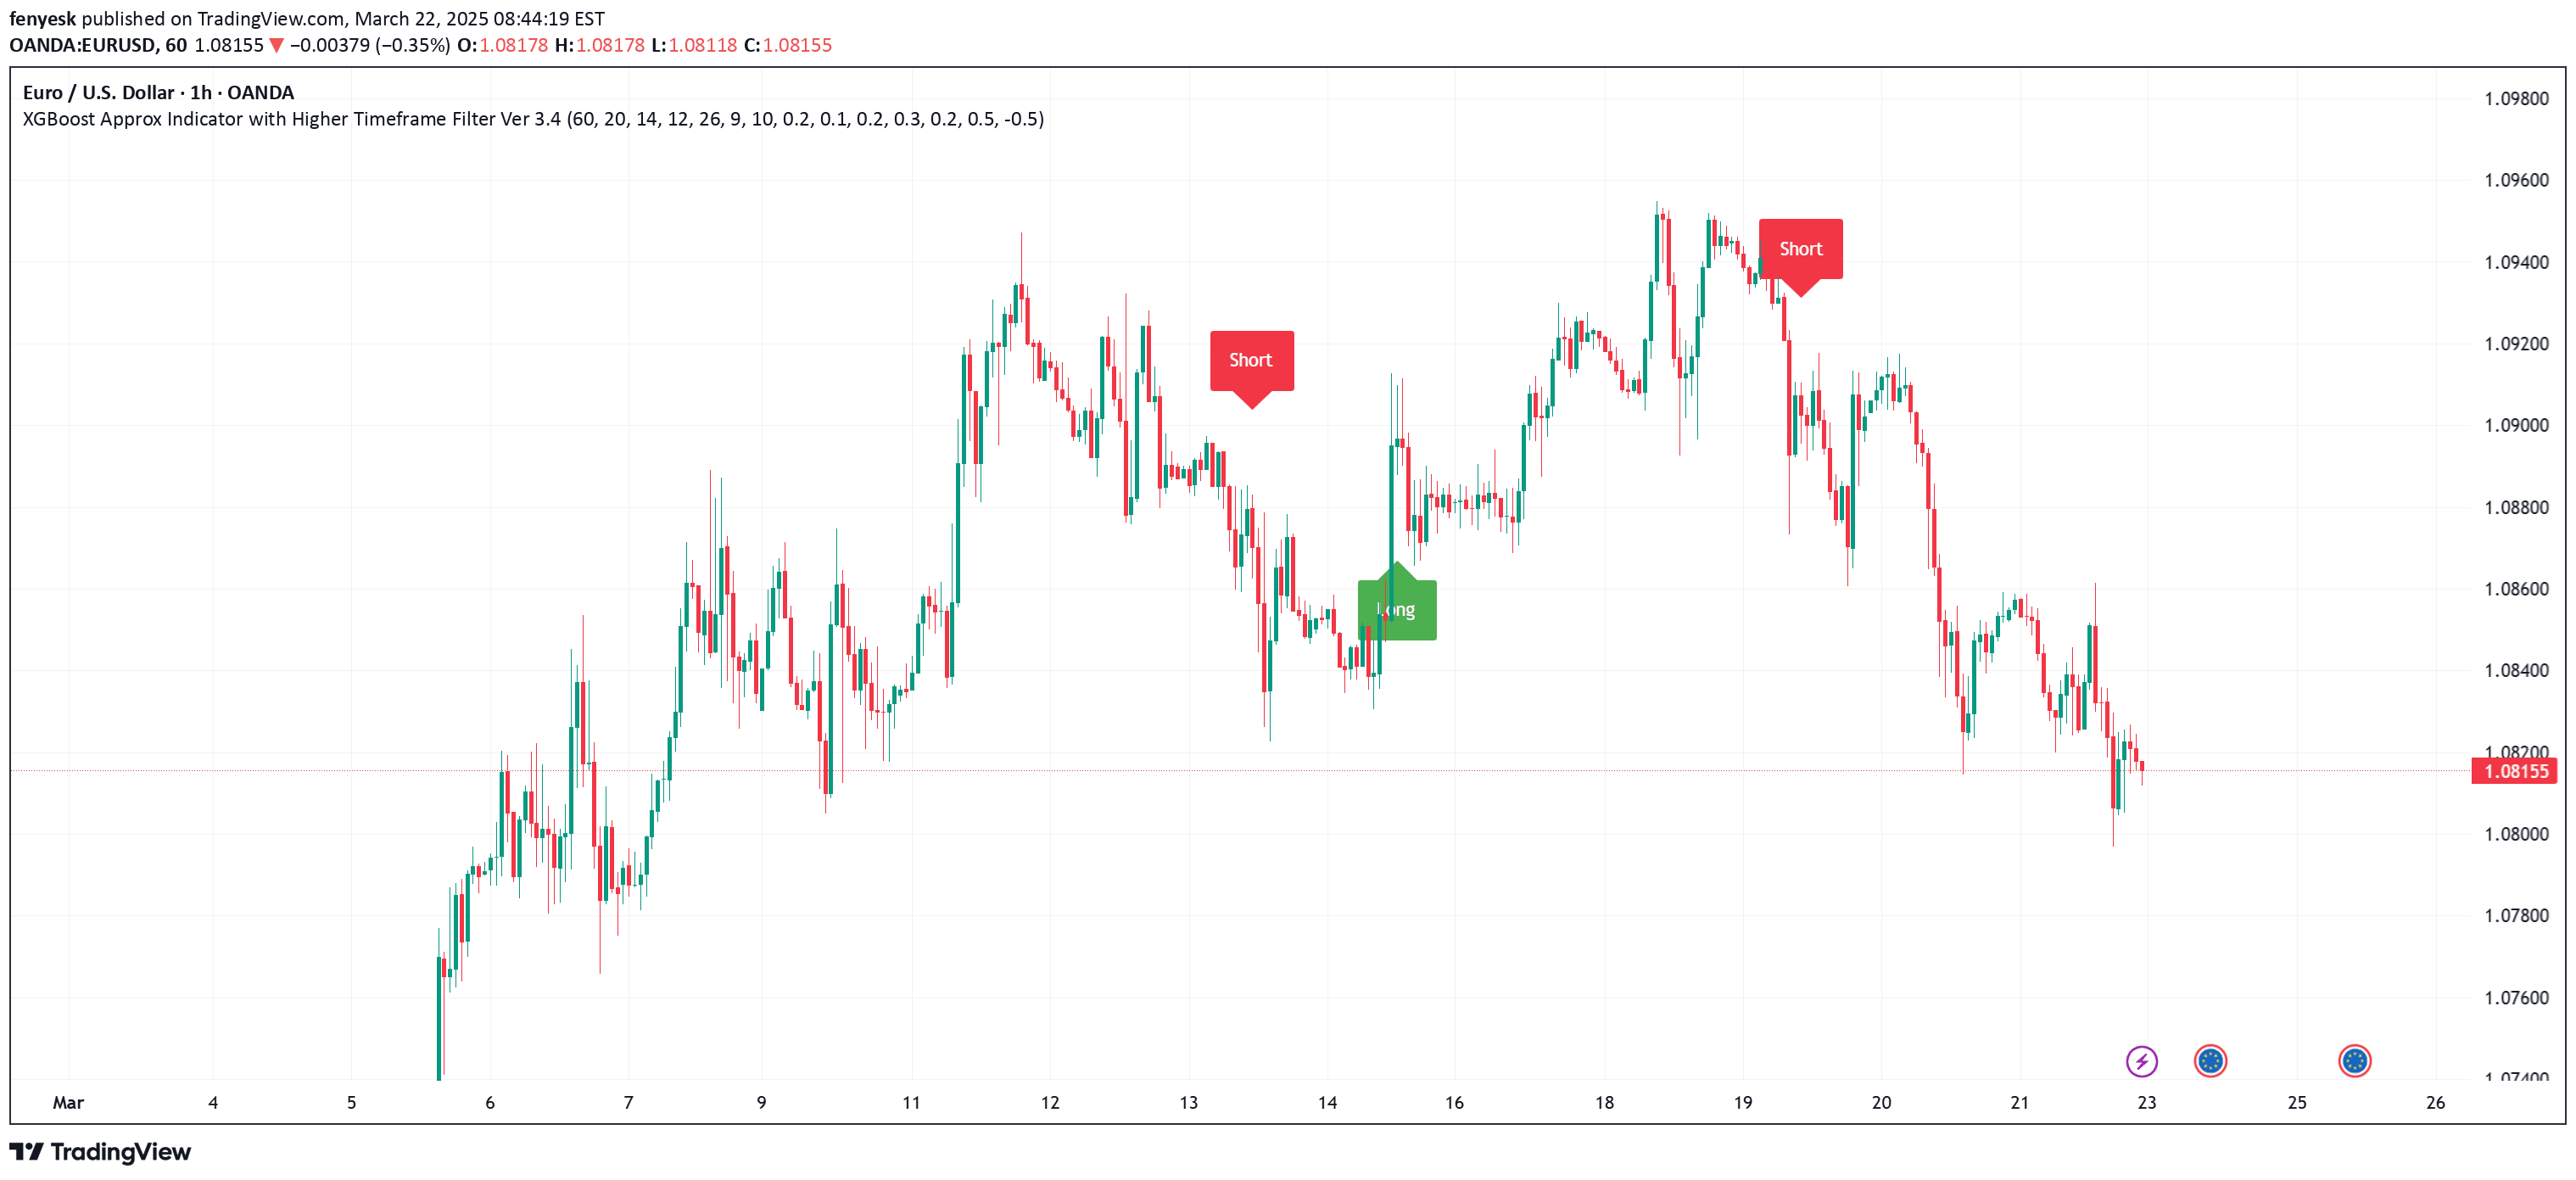
A powerful trading indicator combining ICT and RTM strategies to identify high-probability reversals and trend momentum with precision and disciplined signal generation.
Explore complementary indicator rolesHow it works
The indicator leverages a sophisticated price action analysis framework that identifies key supply and demand zones using a 50-period high/low calculation. It generates trading signals by evaluating multiple confirmation criteria, including volume spikes that are at least 1.5 times the average trading volume and a follow-through candle pattern.
The system employs a customizable Simple Moving Average (default 14 periods) to align reversal signals with overall market momentum. By implementing a strict one-signal discipline, the tool ensures traders focus on the most valid setup, preventing signal clutter and maintaining a clear, disciplined approach to market analysis.
Why it may be useful
Traders often struggle with market noise and false signals that can lead to poor decision-making and unnecessary losses. This indicator cuts through that complexity by providing a refined, multi-layered approach to identifying high-probability trading opportunities with enhanced precision and reduced false positive rates.
By integrating ICT conceptual zones with RTM reversal strategies, the tool offers traders a comprehensive framework for understanding market dynamics. It transforms complex price action analysis into actionable insights, helping traders make more informed decisions with greater confidence and reduced emotional interference.
When to explore it
The indicator is most effective in markets with clear directional movement and sufficient liquidity, such as major forex pairs, stock indices, and actively traded commodities. It performs exceptionally well during periods of moderate to high market volatility where price action shows distinct trending or ranging characteristics.
Traders should apply this tool across multiple timeframes, from scalping to swing trading, but with particular emphasis on periods where volume and momentum align. It is especially powerful during market open sessions, around major economic news events, and in timeframes that exhibit consistent price structure and predictable market behavior.
Keep exploring
What we’ve verified
Access, alerts and repainting behaviour have not been independently verified for this indicator. Check the creator’s current publication and settings.
General descriptions and classifications are recovered research. Verified details above identify the specific checks we have completed. Check the creator’s current publication for later changes.