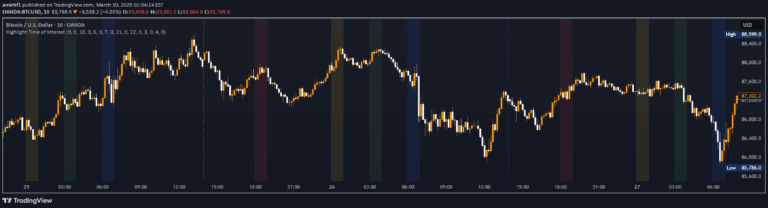
A minimalistic trading indicator designed to help traders visualize and track specific market sessions and time zones with customizable color schemes and automatic timezone handling.
Explore complementary indicator rolesHow it works
This indicator automatically plots selected trading sessions on the chart, eliminating manual timezone calculations. Users can enable predefined market sessions like Morning Session, Lunch, Afternoon Session, and specific Marco time windows with a simple selection.
The script provides flexibility by allowing traders to customize the color of each time session to match their preferred chart aesthetic. By overlaying these time zones directly on the price chart, traders can quickly identify and focus on specific trading periods without complex configuration.
Why it may be useful
Traders often struggle with identifying optimal trading windows across different market sessions and timezones. This indicator simplifies the process by automatically highlighting key trading periods, reducing cognitive load and helping traders stay focused on potential opportunities.
By providing a clean, minimalistic overlay of trading sessions, the indicator helps traders maintain chart clarity while still accessing critical time-based information. The customizable color schemes further enhance user experience by allowing personalization of the visual display.
When to explore it
This indicator is most effective for day traders and scalpers who rely on specific market sessions and time windows for their trading strategies. It works best on timeframes up to hourly, providing maximum utility for short-term trading approaches.
Traders focusing on specific market periods like London Open, Marco windows, or Silver Bullet sessions will find this tool particularly valuable. It's especially useful for traders who trade across multiple markets or need to synchronize their strategies with precise time-based entry and exit points.
Keep exploring
What we’ve verified
Access, alerts and repainting behaviour have not been independently verified for this indicator. Check the creator’s current publication and settings.
General descriptions and classifications are recovered research. Verified details above identify the specific checks we have completed. Check the creator’s current publication for later changes.