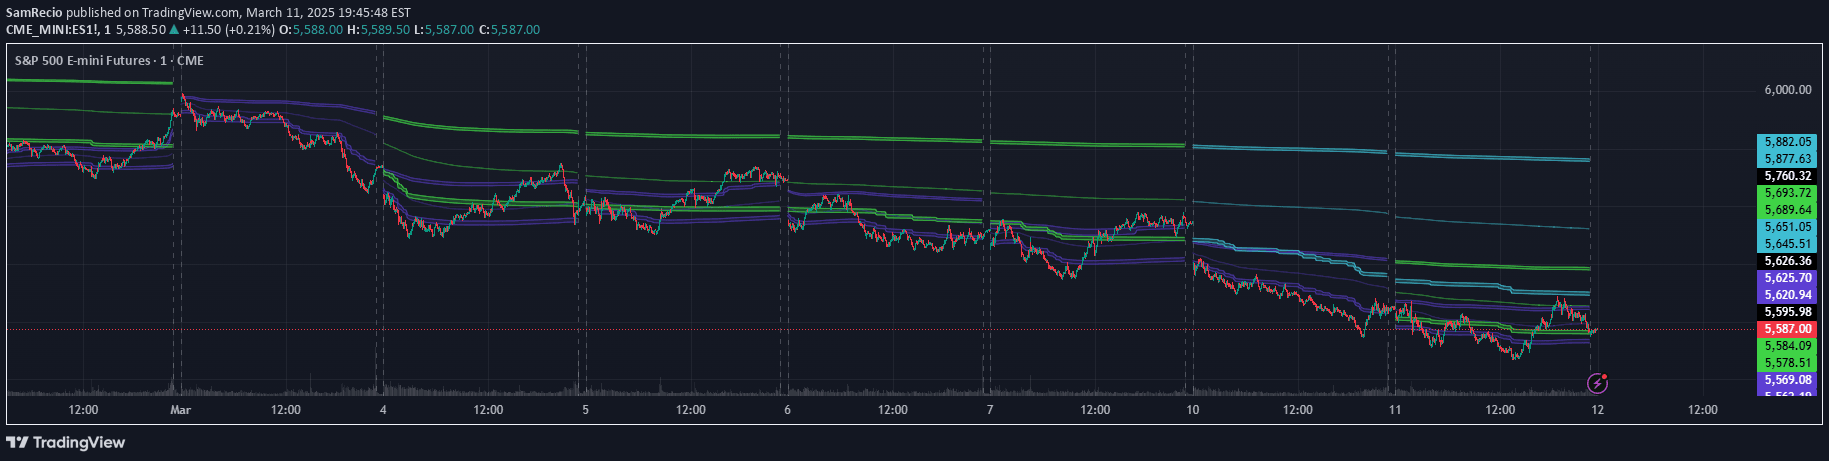
A Pine Script indicator that plots institutional price levels with customizable whole, half, and quarter levels to help traders identify key market reference points.
Explore complementary indicator rolesHow it works
The indicator automatically calculates and plots horizontal lines across key price levels based on user-defined minimum and maximum ranges. It identifies levels as whole (multiples of 1000), half (multiples of 500), and quarter (multiples of 250) levels with a consistent step size of 50 points.
By using functional helpers like getLineStyle and plotLevel, the script converts user preferences into visual chart elements. Traders can customize each level type with specific colors, line styles, and widths, allowing for personalized and intuitive institutional level visualization.
Why it may be useful
Institutional levels provide critical insights into potential market support, resistance, and psychological price points where significant trading activity might occur. These levels help traders understand potential price congestion zones and identify areas where institutional traders might be active.
By offering a systematic approach to visualizing these key price levels, the indicator enables traders to make more informed decisions about entry, exit, and risk management. The customizable nature of the tool allows traders to adapt the visualization to their specific trading style and market interpretation.
When to explore it
This indicator is most effective in markets with clear directional trends and when trading instruments that tend to respect round number levels. It works particularly well in liquid markets like forex, stock indices, and major cryptocurrencies where institutional trading activity is prominent.
Traders should use this tool in conjunction with other technical analysis methods to confirm signals and validate potential trade setups. It is especially useful during range-bound markets or when price is approaching significant whole number levels where market psychology can play a crucial role in price movement.
Keep exploring
What we’ve verified
Access, alerts and repainting behaviour have not been independently verified for this indicator. Check the creator’s current publication and settings.
General descriptions and classifications are recovered research. Verified details above identify the specific checks we have completed. Check the creator’s current publication for later changes.