
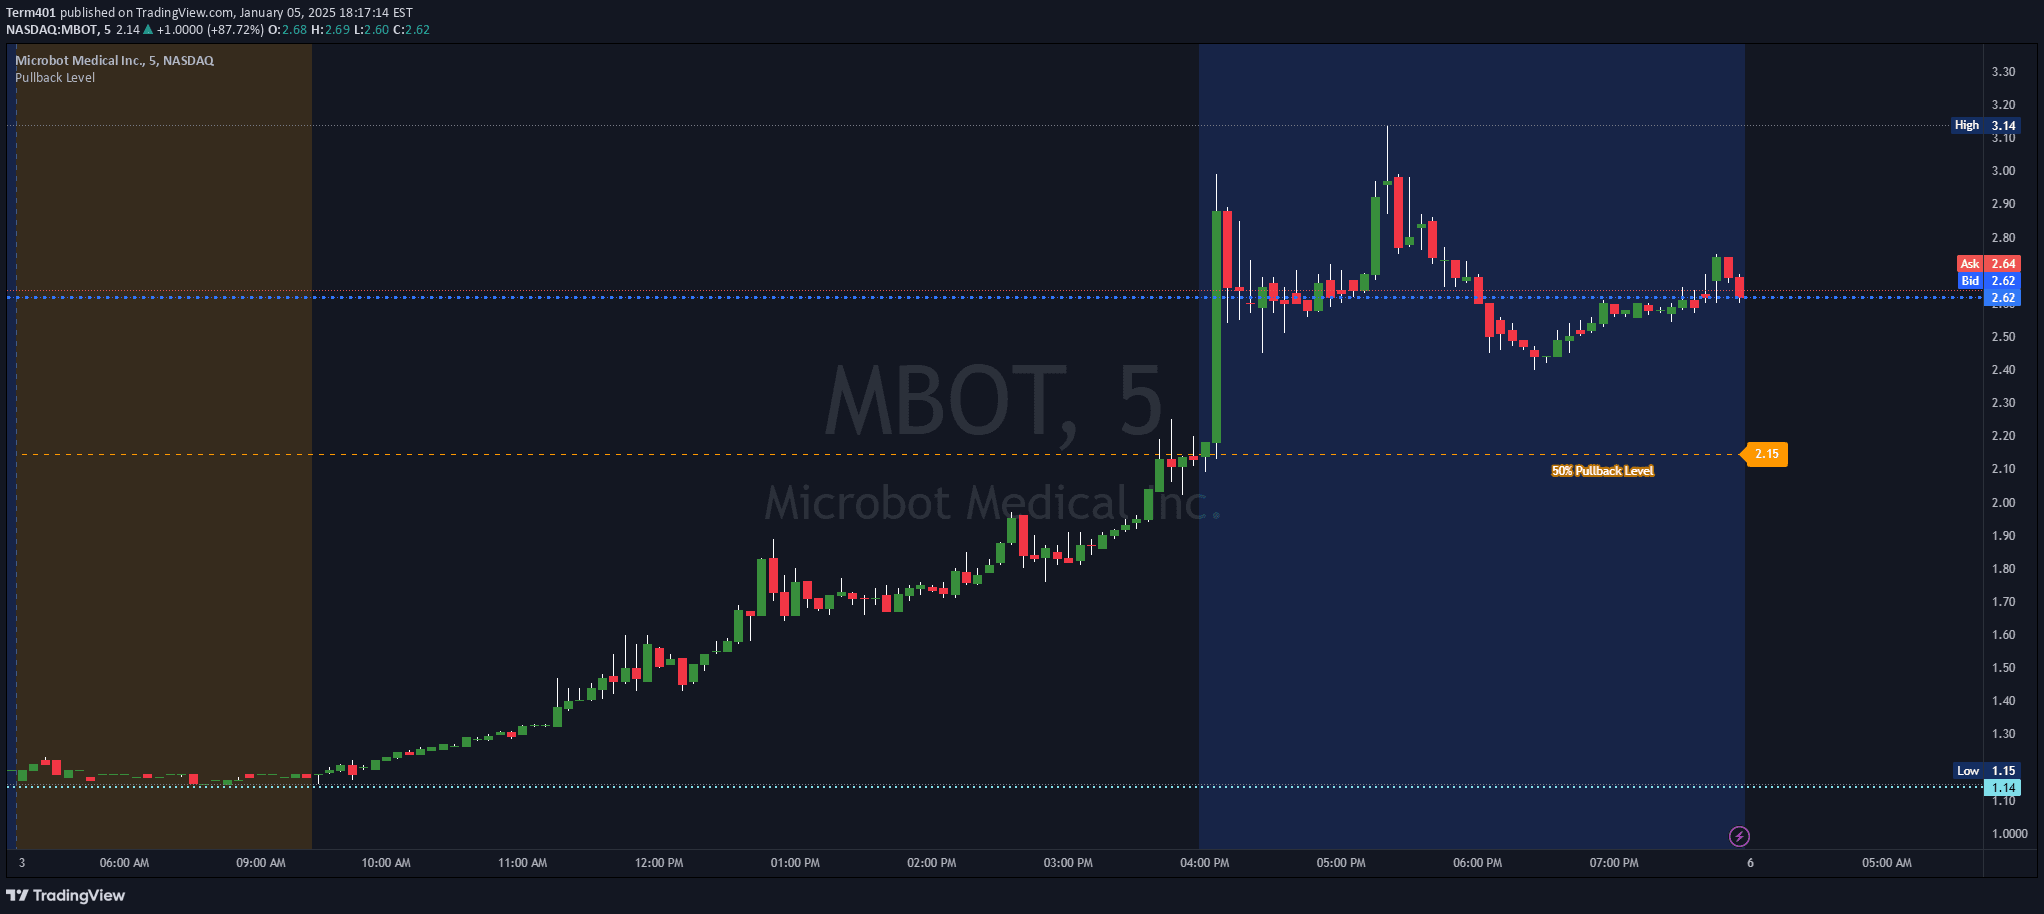
A custom pullback tracking tool that helps traders identify potential stock continuation by setting dynamic support levels based on daily price range and percentage of gains held.
Explore complementary indicator rolesHow it works
The pullback tracking signal starts by identifying the current day's low and high price points for a stock. Traders can then set a custom pullback level, typically based on a percentage of the stock's daily gains, such as 33% or 50% of the price range. This level is plotted directly on the chart as a line with a label, providing a visual reference point for potential trend continuation.
By marking this custom pullback level, traders can quickly assess whether a stock is maintaining its momentum or potentially losing strength. The tool allows for easy monitoring of the stock's price action in relation to the established pullback level, helping traders make more informed decisions about potential entry or exit points.
Why it may be useful
Pullback tracking is crucial for momentum traders seeking to understand the strength and sustainability of a stock's current trend. By setting a custom level that represents a meaningful percentage of daily gains, traders can quickly gauge whether a stock is likely to continue its bullish momentum or potentially reverse direction.
This approach provides a more nuanced view of price action beyond simple trend following. The signal matters because it transforms abstract percentage concepts into a concrete, visually trackable indicator. Traders can customize their pullback threshold based on their risk tolerance and trading strategy, making it a flexible tool for different trading styles and market conditions.
When to explore it
This pullback tracking signal is most effective during periods of strong directional movement, particularly for stocks experiencing significant daily price changes. It works best in volatile markets where momentum can shift quickly, allowing traders to make rapid assessments about potential trend continuation or reversal. Ideal for day traders and scalpers who need quick, visual indicators of market sentiment.
The tool is particularly useful during earnings seasons, major news events, or sector-wide movements that can cause substantial price fluctuations. Traders should combine this signal with other technical indicators and fundamental analysis to create a comprehensive trading strategy, using the pullback level as one of multiple decision-making tools.
Keep exploring
What we’ve verified
Access, alerts and repainting behaviour have not been independently verified for this indicator. Check the creator’s current publication and settings.
General descriptions and classifications are recovered research. Verified details above identify the specific checks we have completed. Check the creator’s current publication for later changes.


