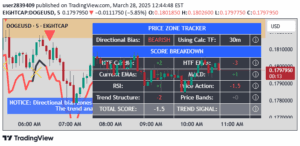
A trading indicator that visualizes global market sessions, highlighting key price levels and transitions across Asian, London, and New York trading periods.
Explore complementary indicator rolesHow it works
The session indicator segments the trading day into distinct global market periods like Asian, London, and New York sessions, each represented by color-coded boxes on the chart. It automatically plots horizontal lines marking the high and low price levels within each session, allowing traders to quickly identify key price boundaries and potential support or resistance zones.
The indicator uses vertical lines to mark session transitions, providing clear visual cues about market timing and potential shifts in trading dynamics. By color-coding different sessions and displaying precise time ranges, traders can easily track how market activity evolves across different global financial centers.
Why it may be useful
Understanding market session dynamics is crucial for traders seeking to optimize their entry and exit strategies across different global trading environments. The indicator provides a structured visual representation of how price action varies between major financial centers, helping traders anticipate potential market movements and identify optimal trading windows.
By highlighting session-specific price levels and transitions, the tool enables traders to make more informed decisions based on the unique characteristics of each trading period. This insight is particularly valuable for those trading currency pairs or instruments influenced by international market activities.
When to explore it
This session indicator is most effective for traders focusing on forex, futures, or other markets with significant international participation. It becomes particularly useful during periods of high market volatility, such as when major financial centers like London and New York have overlapping trading hours.
Traders can leverage this tool to identify potential breakout points, recognize session-specific trading patterns, and adjust their strategies according to the different liquidity and volatility characteristics of each global market session.
Keep exploring
What we’ve verified
Access, alerts and repainting behaviour have not been independently verified for this indicator. Check the creator’s current publication and settings.
General descriptions and classifications are recovered research. Verified details above identify the specific checks we have completed. Check the creator’s current publication for later changes.