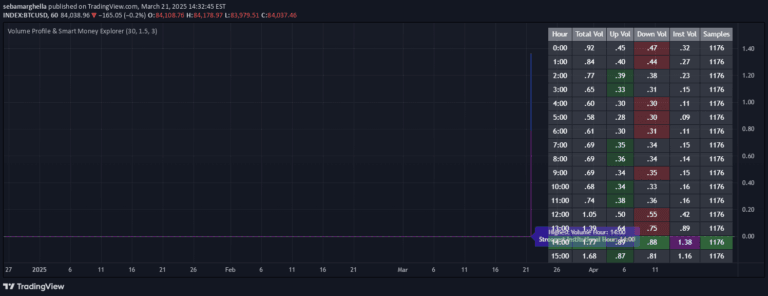
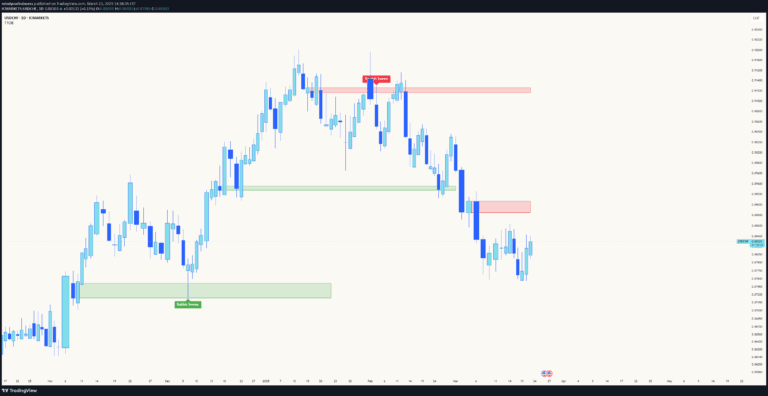
A market analysis tool that tracks hidden buying and selling activity by combining price spread, volume behavior, market pressure, and depth to identify liquidity dynamics.
Explore complementary indicator rolesHow it works
The IU Liquidity Flow Tracker employs a multi-factor model to evaluate market behavior by analyzing several key components. It first calculates liquidity pressure by integrating price spread, price efficiency, and volume imbalance, then determines flow direction using weighted momentum across different timeframes.
The indicator then assesses market depth through wick-based rejection scoring to estimate buying and selling aggressiveness at price extremes. It creates a composite flow index by blending flow direction, pressure, and depth, which is then smoothed for enhanced clarity and dynamically adjusts thresholds based on current market volatility.
Why it may be useful
This indicator provides traders with a unique, comprehensive view of market dynamics that goes beyond traditional price and volume analysis. By combining multiple factors like spread behavior, volume polarity, momentum weighting, and price rejection zones, it offers a more nuanced understanding of market movements.
The tool's dynamic sensitivity and multi-factor confirmation approach help traders reduce false signals and noise, making it particularly valuable for identifying subtle shifts in market sentiment and potential institutional activity before significant price moves.
When to explore it
The IU Liquidity Flow Tracker is most effective during periods of changing market conditions where traditional indicators might provide incomplete or misleading signals. It works exceptionally well in markets with significant volume and clear directional movements, helping traders identify potential trend reversals and momentum shifts.
Traders can leverage this tool across various timeframes and trading styles, from scalping to swing trading, making it versatile for different market participants. It is particularly useful when seeking to understand underlying market structure and detecting potential accumulation or distribution phases.
Keep exploring
What we’ve verified
Access, alerts and repainting behaviour have not been independently verified for this indicator. Check the creator’s current publication and settings.
General descriptions and classifications are recovered research. Verified details above identify the specific checks we have completed. Check the creator’s current publication for later changes.