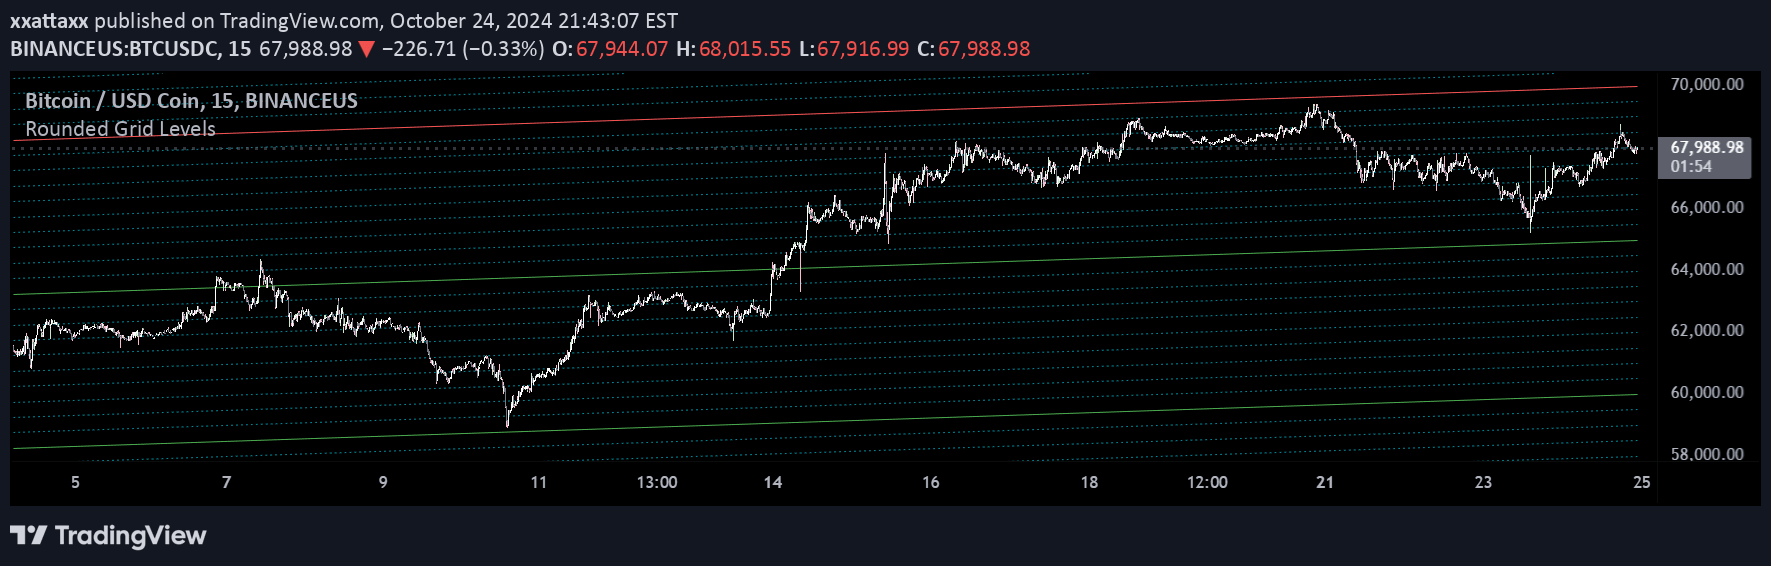
A trading tool that calculates horizontal support and resistance levels using square root transformations, offering two calculation modes with customizable spacing and direction.
Explore complementary indicator rolesHow it works
The Square Root Levels indicator uses mathematical transformations to generate key trading levels by calculating square roots of significant price points. In the Octave System mode, it divides the square root range into specified steps, creating proportionally or evenly spaced levels that can be extended up, down, or in both directions.
The Square Root Multiples mode adds or subtracts multiples of the original square root to create harmonic price levels. Traders can customize the calculation by selecting the price point, number of octave divisions, and the extent of level repetitions, allowing for flexible and precise level identification.
Why it may be useful
This indicator provides traders with a unique geometric approach to identifying potential support and resistance levels based on mathematical harmonics. By transforming price points through square root calculations, it reveals hidden structural relationships in price movements that traditional methods might overlook.
The systematic approach offers traders a disciplined method for identifying key trading levels, helping to improve entry and exit decisions. Its flexibility in calculation modes and customization options allows traders to adapt the tool to different market conditions and trading styles.
When to explore it
The Square Root Levels indicator is most effective in markets with clear trending or range-bound characteristics where geometric price relationships are more pronounced. It works particularly well in forex, futures, and liquid stock markets where price movements tend to exhibit more predictable harmonic patterns.
Traders should use this tool in conjunction with other technical analysis methods, treating the levels as potential support and resistance zones rather than absolute trading signals. It is especially useful for identifying potential reversal points, setting stop-loss levels, and understanding the underlying geometric structure of price action.
Keep exploring
What we’ve verified
Access, alerts and repainting behaviour have not been independently verified for this indicator. Check the creator’s current publication and settings.
General descriptions and classifications are recovered research. Verified details above identify the specific checks we have completed. Check the creator’s current publication for later changes.