A VIX-based trading signal that identifies potential market drop opportunities by tracking volatility spikes and price action across multiple timeframes and conditions.
Explore complementary indicator rolesHow it works
The signal operates by monitoring VIX volatility spikes across four different settings, drawing visual markers to highlight potential trading opportunities. It tracks price movements relative to volatility breakouts, specifically looking for scenarios where price drops and takes out previous prominent lows.
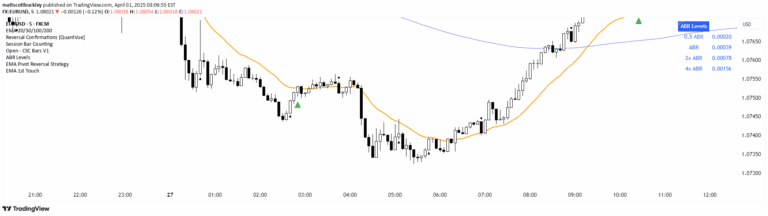
The indicator uses multiple visual cues like white lines, dotted green and pink lines, and strategic dot placements to signal potential entry points. It incorporates higher timeframe EMAs and additional technical analysis elements to provide a comprehensive view of market conditions and potential trend reversals.
Why it may be useful
This signal provides traders with a structured approach to identifying potential market turning points during periods of increased volatility. By combining VIX analysis with price action and visual markers, traders can more effectively assess potential entry and exit points with greater precision.
The indicator's multiple visual cues help traders quickly recognize complex market dynamics that might otherwise be difficult to interpret. Its focus on volatility and price relationship allows traders to make more informed decisions during potentially turbulent market conditions.
When to explore it
The signal is most effective during periods of market uncertainty and potential trend reversals, particularly in highly liquid markets like index trading. It works best on shorter timeframes, with the developer specifically noting its optimization for 1-minute charts on instruments like SPX500USD.
Traders should use this signal when seeking opportunities during significant market drops, looking for confirmatory signals like price taking out previous lows and showing specific price action patterns. It's particularly useful for traders comfortable with volatility-based strategies and quick decision-making.
Keep exploring
What we’ve verified
Access, alerts and repainting behaviour have not been independently verified for this indicator. Check the creator’s current publication and settings.
General descriptions and classifications are recovered research. Verified details above identify the specific checks we have completed. Check the creator’s current publication for later changes.