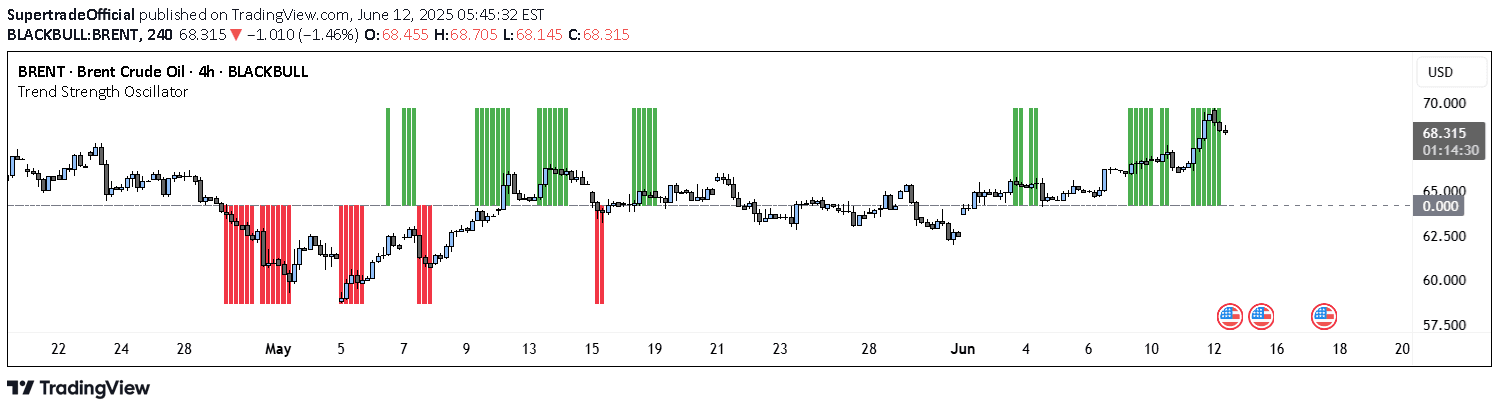
A VIX-based indicator that colors chart bars to highlight market volatility extremes, helping traders identify potential market turning points and sentiment shifts.
Explore complementary indicator rolesHow it works
The VIX Bars indicator works by monitoring the Volatility Index (VIX) and dynamically coloring chart bars based on predefined volatility thresholds. Users can customize the upper and lower VIX levels, which determine when bars turn green or red, signaling market volatility conditions.
An optional Donchian Channel filter adds an extra layer of confirmation by examining the highest highs and lowest lows over a specified period (default 52 days). This filter ensures that colored bars align with significant market price extremes, providing traders with a more refined view of potential market turning points.
Why it may be useful
The VIX Bars indicator is crucial because it provides a visual representation of market sentiment and volatility, helping traders quickly assess potential market risks and opportunities. By highlighting extreme VIX levels, traders can identify periods of heightened market uncertainty or potential trend reversals.
The indicator's simplicity allows traders to quickly interpret market conditions without overwhelming them with complex data. The color-coded bars serve as an immediate visual cue, enabling traders to make more informed decisions about market entry, exit, and risk management strategies.
When to explore it
The VIX Bars indicator is most effective during periods of significant market volatility, such as economic announcements, earnings seasons, or global events that can cause market turbulence. Traders can use this tool to identify potential market turning points and assess the overall market sentiment.
It works particularly well when combined with other volatility indicators like the VIX Heatmap, providing a comprehensive view of market conditions. Traders should be cautious and use the indicator as part of a broader analysis strategy, recognizing that while it offers insights, it does not make definitive price predictions.
Keep exploring
What we’ve verified
Access, alerts and repainting behaviour have not been independently verified for this indicator. Check the creator’s current publication and settings.
General descriptions and classifications are recovered research. Verified details above identify the specific checks we have completed. Check the creator’s current publication for later changes.