
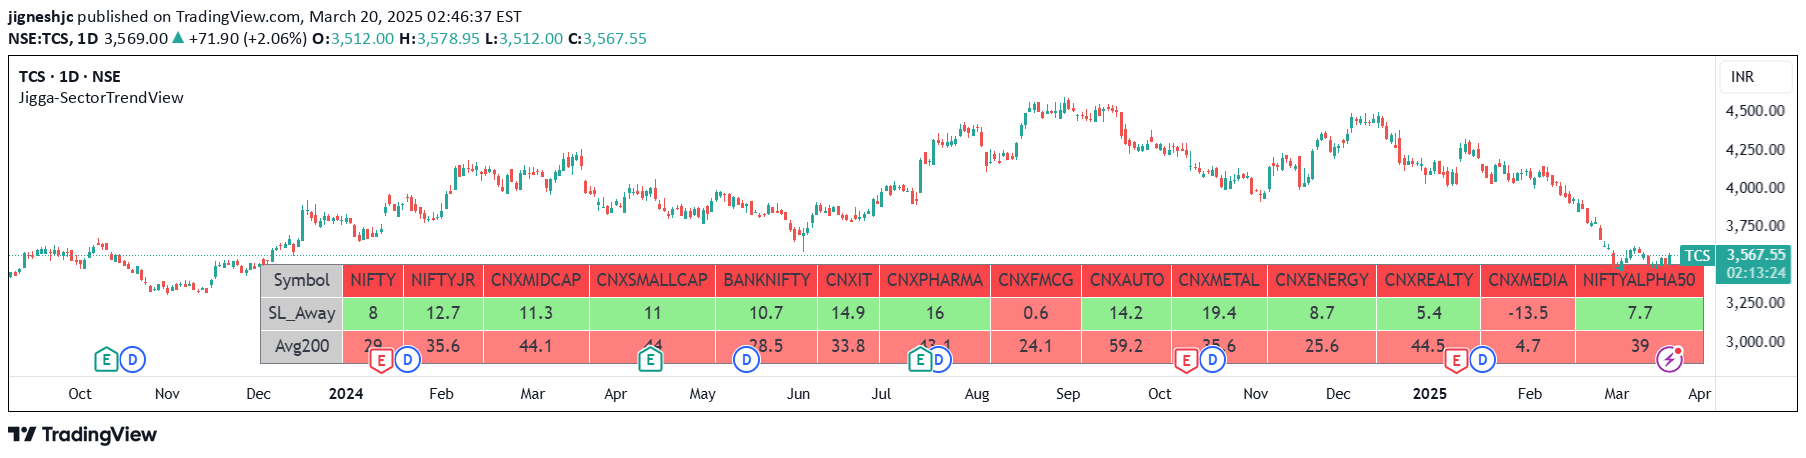
Jigga-SectorView is an indicator that analyzes sector trends by calculating technical values, tracking 52-week lows, and evaluating moving average crossovers to provide sector performance insights.
Explore complementary indicator rolesHow it works
The Jigga-SectorView script operates by systematically analyzing multiple sector indices through a series of technical calculations. It first retrieves the 52-week lowest low for each selected symbol and compares it with the current daily closing price. The indicator then evaluates trend shifts by examining crossovers between the 50-day and 200-day exponential moving averages (EMAs).
By calculating the percentage difference from identified price levels, the script generates a comprehensive view of sector performance. This method allows traders to understand relative sector strengths and potential momentum changes across different market segments
Why it may be useful
Understanding sector trends is crucial for making informed investment decisions and identifying potential market opportunities. The Jigga-SectorView provides traders with a structured overview of sector performance, helping them assess relative strengths and weaknesses across different market segments.
By tracking technical indicators like moving average crossovers and comparing current prices to historical lows, traders can gain insights into potential trend shifts and sector rotation. This comprehensive approach enables more strategic asset allocation and helps investors identify sectors with stronger momentum and growth potential
When to explore it
The Jigga-SectorView is most effective during periods of market transition or when seeking to understand broader market dynamics. It works best for traders looking to compare sector performance, identify emerging trends, and make informed asset allocation decisions.
The indicator is particularly useful during market rotations, economic sector shifts, and when analyzing long-term investment strategies. Traders can leverage this tool during swing trading scenarios, when evaluating multi-day or multi-week sector trends, and when seeking to diversify investments across different market segments
Keep exploring
What we’ve verified
Access, alerts and repainting behaviour have not been independently verified for this indicator. Check the creator’s current publication and settings.
General descriptions and classifications are recovered research. Verified details above identify the specific checks we have completed. Check the creator’s current publication for later changes.


