
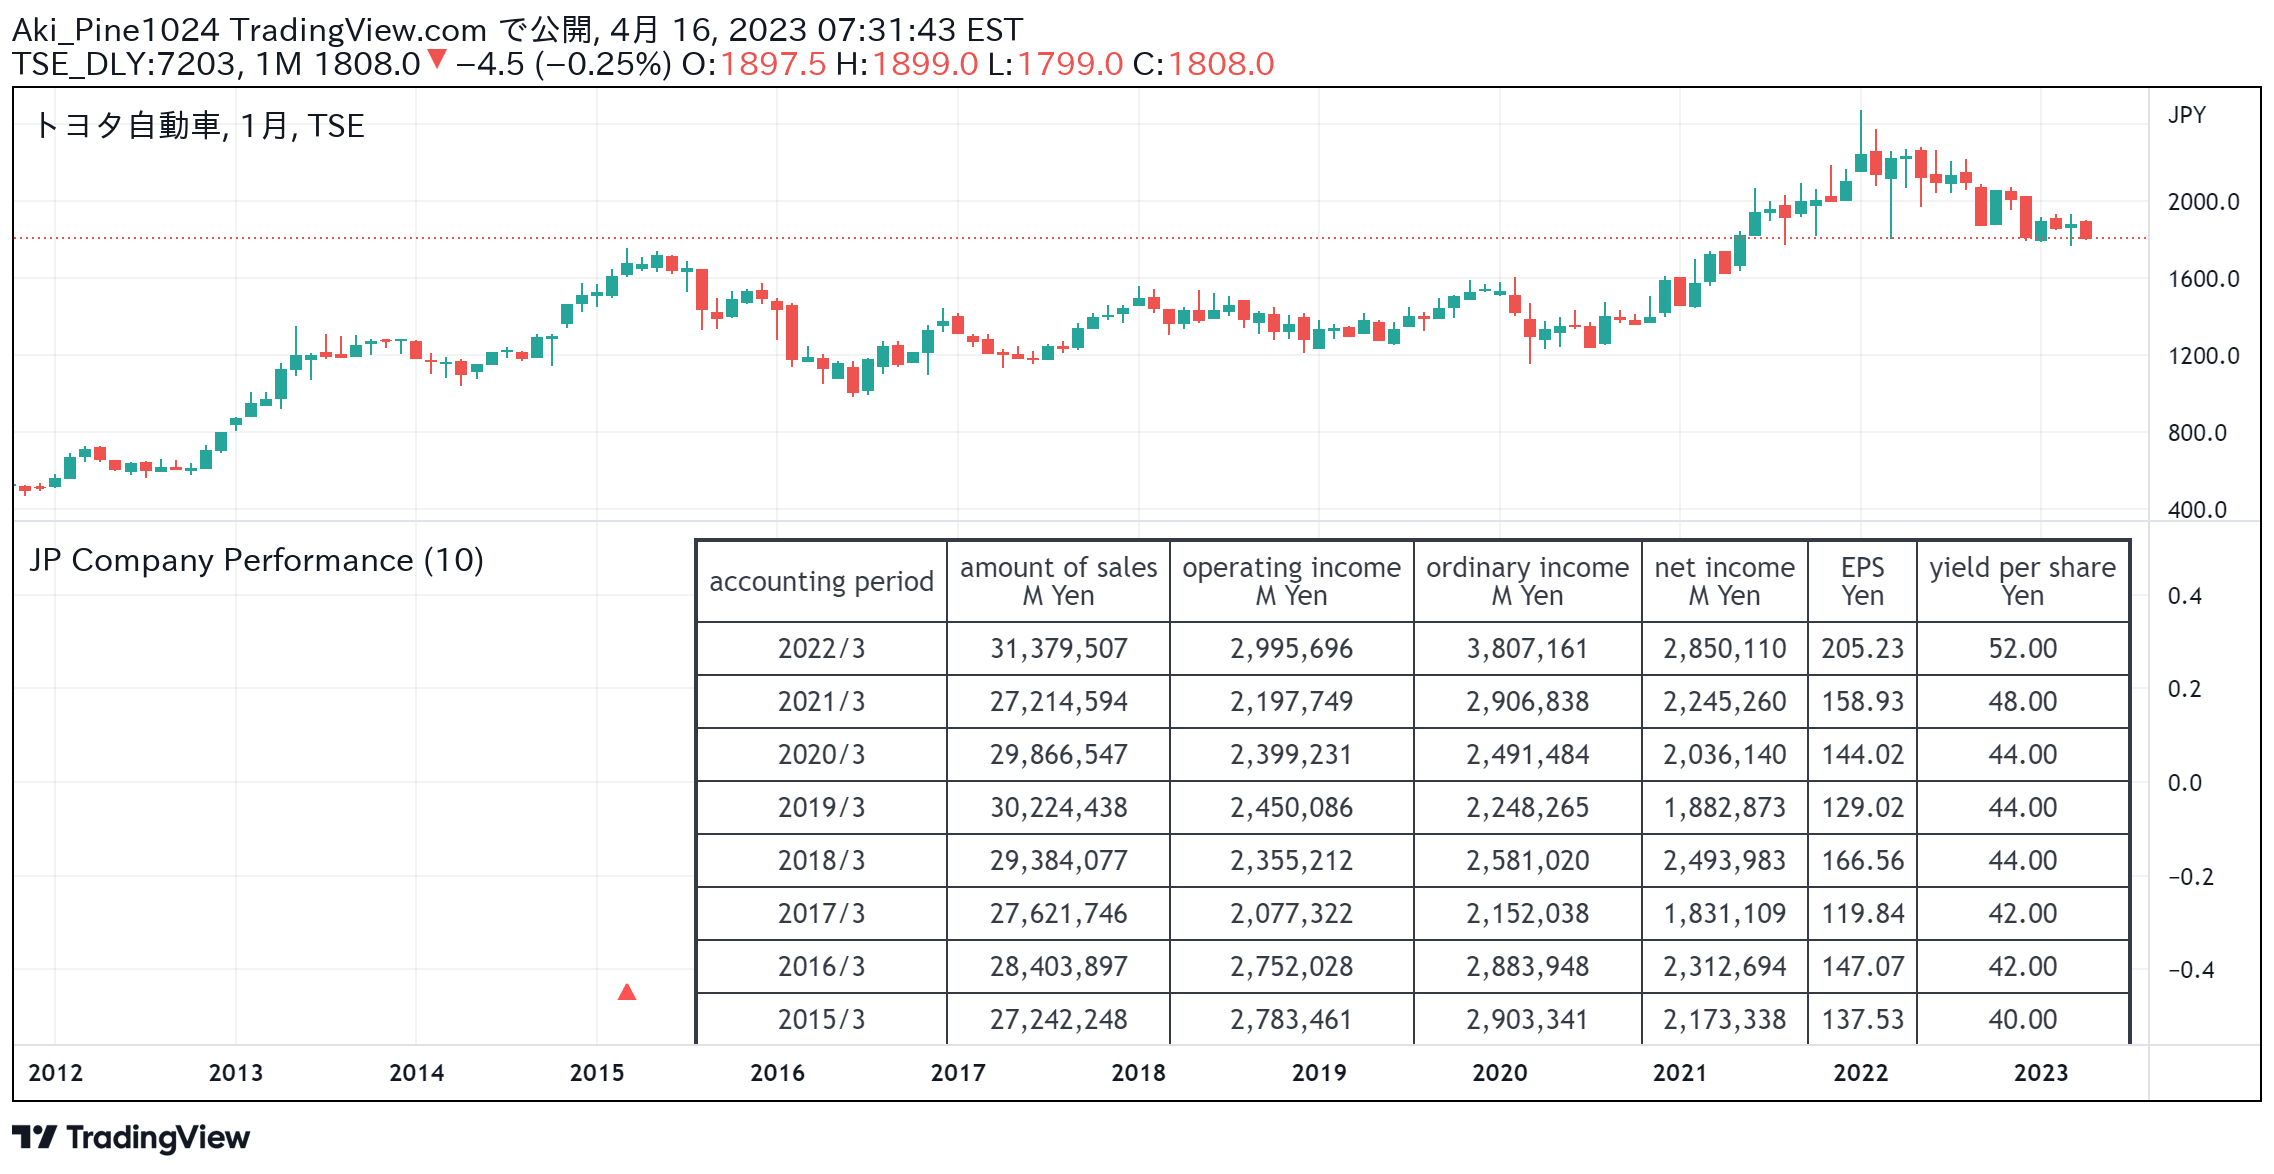
A trading signal that displays performance metrics for Japanese companies in a tabular format, providing comprehensive insights into financial performance and potential investment opportunities.
Explore complementary indicator rolesHow it works
Japanese company performance data tables compile and organize key financial metrics from various companies listed on Japanese stock exchanges. These tables typically include critical indicators such as revenue, net income, profit margins, earnings per share, and other fundamental financial parameters.
The data is systematically arranged to allow traders and investors to quickly compare and analyze the financial health and performance of different companies across various sectors. By presenting information in a structured format, these tables enable rapid assessment of potential investment opportunities and comparative analysis.
Why it may be useful
Performance data tables provide traders with essential insights into the financial condition and potential growth of Japanese companies. These comprehensive snapshots allow investors to make more informed decisions by evaluating key financial metrics and understanding the comparative strengths of different businesses.
By presenting standardized financial information, these tables help traders identify trends, assess risk, and detect potential investment opportunities across multiple companies and sectors. The systematic presentation of data enables quick and efficient analysis, reducing the time and effort required to research individual company performances.
When to explore it
Performance data tables are most valuable when conducting fundamental analysis of Japanese stock markets and individual company prospects. They are particularly useful during earnings seasons, quarterly financial reporting periods, and when evaluating long-term investment strategies.
Traders should utilize these tables when comparing companies within the same sector, assessing overall market trends, and making strategic investment decisions. They are especially helpful for investors seeking to understand the financial health and potential growth trajectories of Japanese corporations across different industries.
Keep exploring
What we’ve verified
Access, alerts and repainting behaviour have not been independently verified for this indicator. Check the creator’s current publication and settings.
General descriptions and classifications are recovered research. Verified details above identify the specific checks we have completed. Check the creator’s current publication for later changes.


