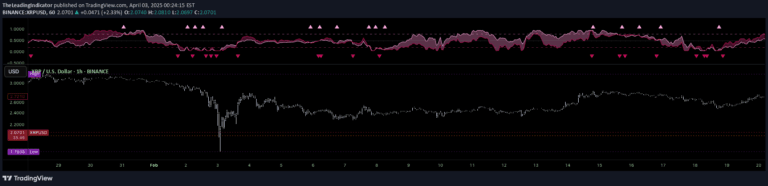
O'Neil Earnings Stability Indicator evaluates stock quality by measuring earnings consistency and growth rate, helping investors identify stocks with stable and strong financial performance.
Explore complementary indicator rolesHow it works
The O'Neil Earnings Stability Indicator calculates a stability score by measuring deviations from an earnings trend line, using a logarithmic scale to emphasize smaller variations. The score ranges from 1-99, with lower scores indicating more consistent earnings growth, providing a systematic approach to evaluating financial stability.
Simultaneously, the indicator assesses annual growth rate by comparing current quarter earnings to the same quarter in the previous year. By calculating percentage change, it determines whether a stock meets the target growth threshold of 25%, creating a comprehensive assessment of both earnings consistency and growth potential.
Why it may be useful
This indicator helps investors filter out stocks with erratic earnings patterns, focusing on companies demonstrating sustainable financial performance. By providing a quantitative method to evaluate earnings stability and growth, it reduces emotional decision-making and introduces objective criteria for stock selection.
The O'Neil Earnings Stability Indicator is particularly valuable for investors seeking high-quality growth stocks with proven track records. It offers a structured approach to identifying companies that demonstrate both consistent earnings and meaningful growth, which can potentially lead to more reliable investment outcomes.
When to explore it
The O'Neil Earnings Stability Indicator is most effective when evaluating growth stocks across medium to long-term investment horizons. It works best during periods of economic expansion when companies have opportunities to demonstrate consistent financial performance and meaningful growth trajectories.
Investors should apply this indicator when conducting fundamental analysis, particularly when screening for potential long-term investments in sectors with strong growth potential. It is especially useful during earnings seasons and when comparing stocks within the same industry or sector.
Keep exploring
What we’ve verified
Access, alerts and repainting behaviour have not been independently verified for this indicator. Check the creator’s current publication and settings.
General descriptions and classifications are recovered research. Verified details above identify the specific checks we have completed. Check the creator’s current publication for later changes.