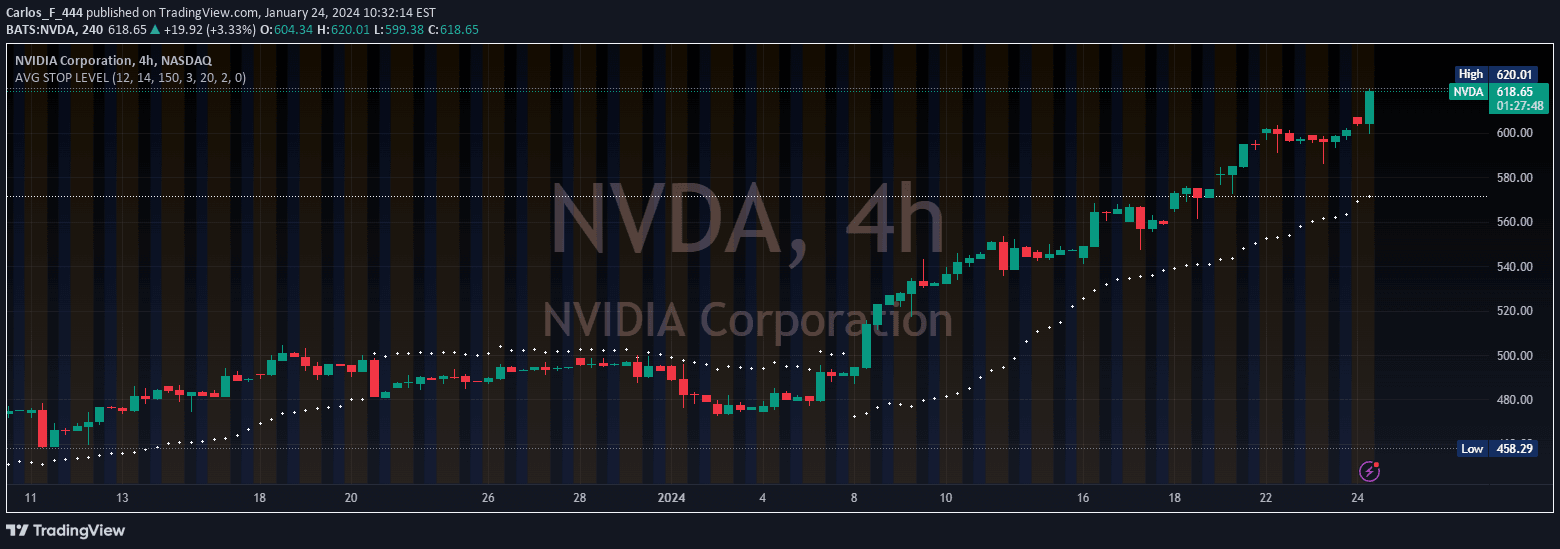
JPMorgan Hedging Collar indicator visualizes key option strategy levels, showing institutional fund hedging approach with strike price boundaries for SPX market analysis.
Explore complementary indicator rolesHow it works
The JPMorgan Hedging Collar indicator plots three critical option strike price levels: the short call (upper bound), long put (protection level), and short put (cost reduction). It creates a visual representation of an institutional hedging strategy used by funds. The indicator maps out the key price boundaries that define the hedging zone.
By tracking these levels, traders can understand the potential market support and resistance points. The strategy is typically updated quarterly to reflect current market conditions. The shaded area between the long put and short call represents the active hedging range
Why it may be useful
This indicator provides insights into institutional trading strategies and market structure near option expiration dates. It helps traders understand potential market movements driven by large fund hedging activities. The visualization allows for better comprehension of complex options strategies used by professional investors.
Traders can gain a deeper understanding of potential market support and resistance levels. The indicator reveals how institutional funds manage risk and optimize their portfolio positions. It offers a unique perspective on market dynamics beyond traditional price analysis. The strategy can provide early signals of potential market direction
When to explore it
The JPMorgan Hedging Collar indicator is most effective during periods of market uncertainty or near quarterly option expiration dates. It works best for traders analyzing institutional market flows and options strategies. The indicator is particularly useful for long-term investors tracking potential market support levels.
Swing traders can benefit from understanding the broader institutional hedging approach. It provides valuable insights during market transitions or when expecting significant market movements. The strategy is most applicable to broad market indices like SPX. Traders should combine this indicator with other technical and fundamental analysis for comprehensive market understanding
Keep exploring
What we’ve verified
Access, alerts and repainting behaviour have not been independently verified for this indicator. Check the creator’s current publication and settings.
General descriptions and classifications are recovered research. Verified details above identify the specific checks we have completed. Check the creator’s current publication for later changes.