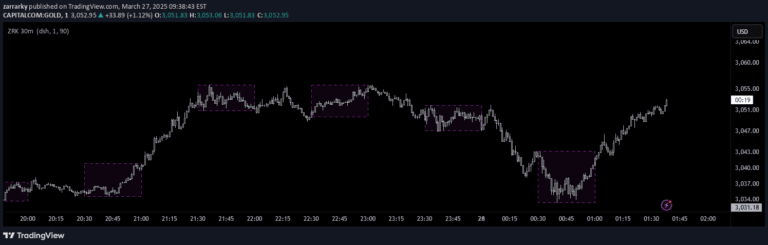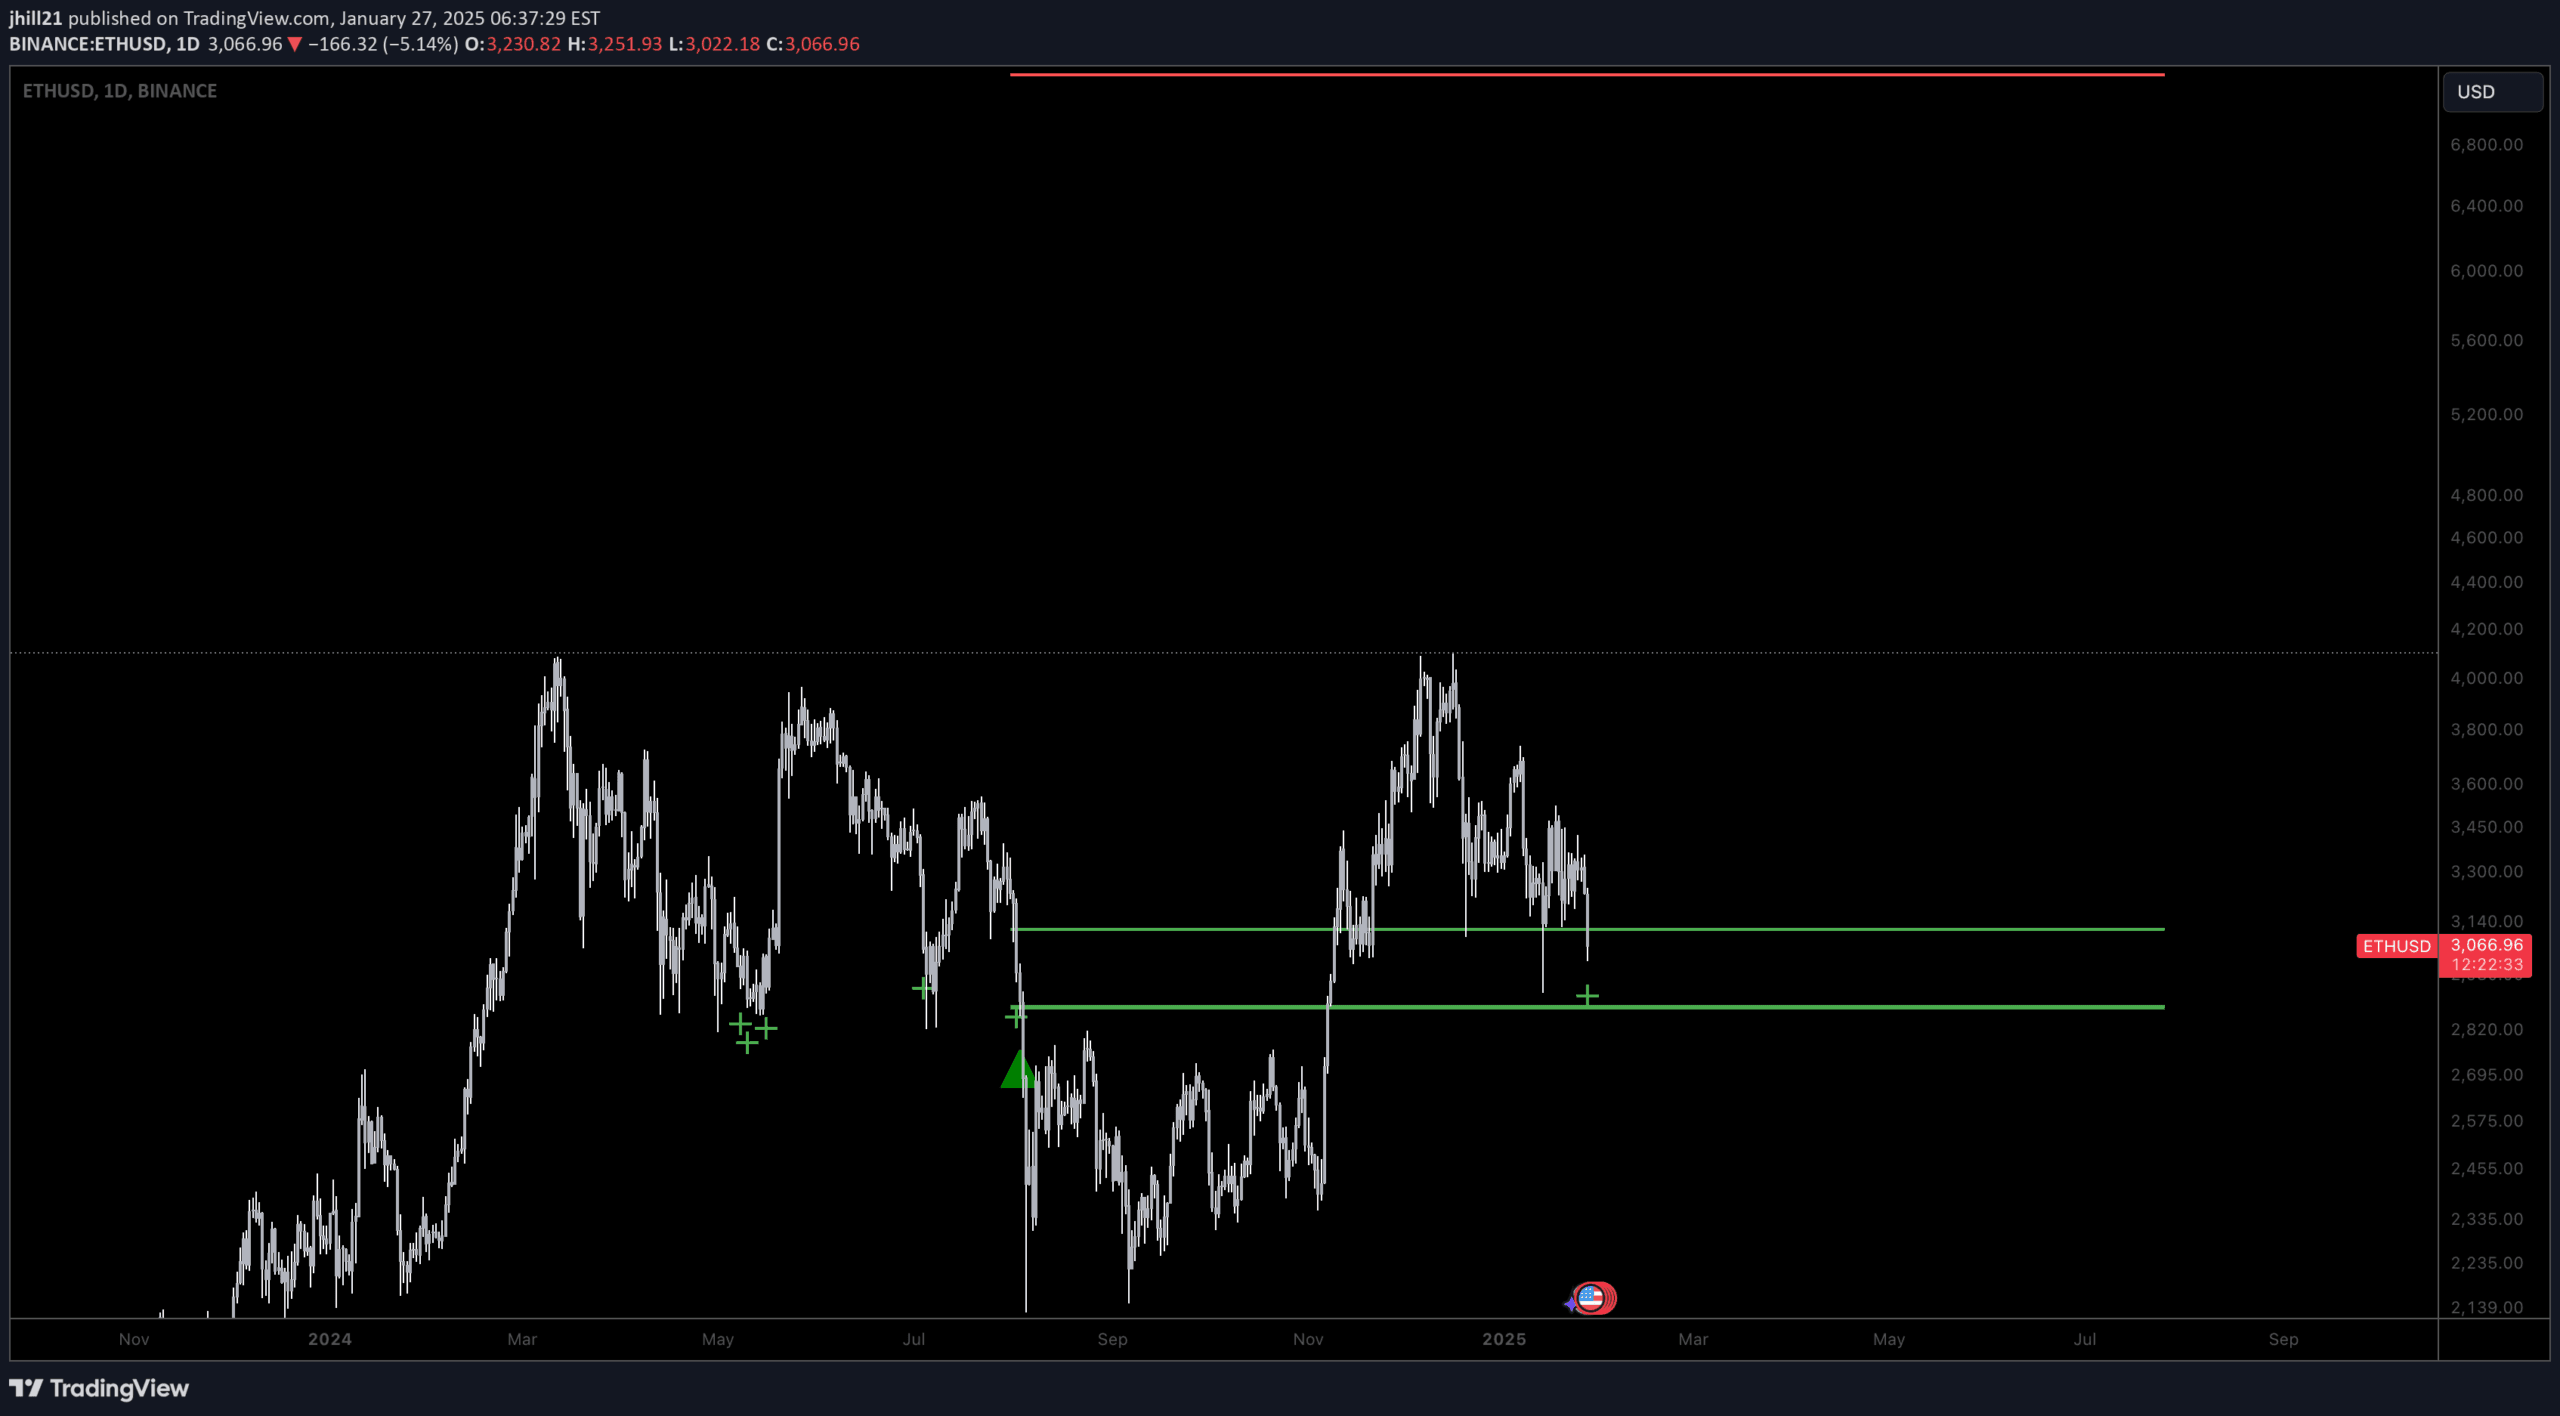
A Fibonacci-based trading indicator that strategically marks key price levels and potential market movements using retracement and extension zones.
Explore complementary indicator rolesHow it works
The Fibonacci Playbook Indicator analyzes the last 180 price bars to identify the highest and lowest price points, establishing a dynamic trading landscape. By plotting strategic retracement levels at 50% and 61.8%, it creates precision zones where price movements are likely to pause, reverse, or continue their current trajectory.
The indicator goes beyond basic retracements by also marking extension levels at 1.618 and 2.618, which represent potential extreme price targets. These levels are visually represented with color-coded lines - green for supportive buy zones and red for potential resistance areas - allowing traders to quickly interpret market dynamics.
Why it may be useful
Fibonacci levels provide traders with mathematically derived price zones that reflect natural market rhythms and psychological trading boundaries. By offering a systematic approach to identifying potential support, resistance, and price targets, this indicator helps traders make more informed decisions about entry, exit, and risk management.
The visual representation of these levels transforms complex mathematical relationships into an intuitive, easy-to-understand trading tool. Traders can quickly assess market sentiment, potential trend reversals, and strategic trading opportunities without getting lost in complex calculations.
When to explore it
The Fibonacci Playbook Indicator is most effective in trending markets with clear directional movements, where price tends to respect mathematical retracement and extension levels. It works exceptionally well in markets with moderate volatility, where price movements are more predictable and less erratic.
Traders should pay special attention to this indicator during key market transitions, such as potential trend reversals, breakouts, or when price approaches significant historical support and resistance zones. It's particularly useful in forex, stock, and cryptocurrency markets where technical analysis plays a crucial role in trading decisions.
Keep exploring
What we’ve verified
Access, alerts and repainting behaviour have not been independently verified for this indicator. Check the creator’s current publication and settings.
General descriptions and classifications are recovered research. Verified details above identify the specific checks we have completed. Check the creator’s current publication for later changes.