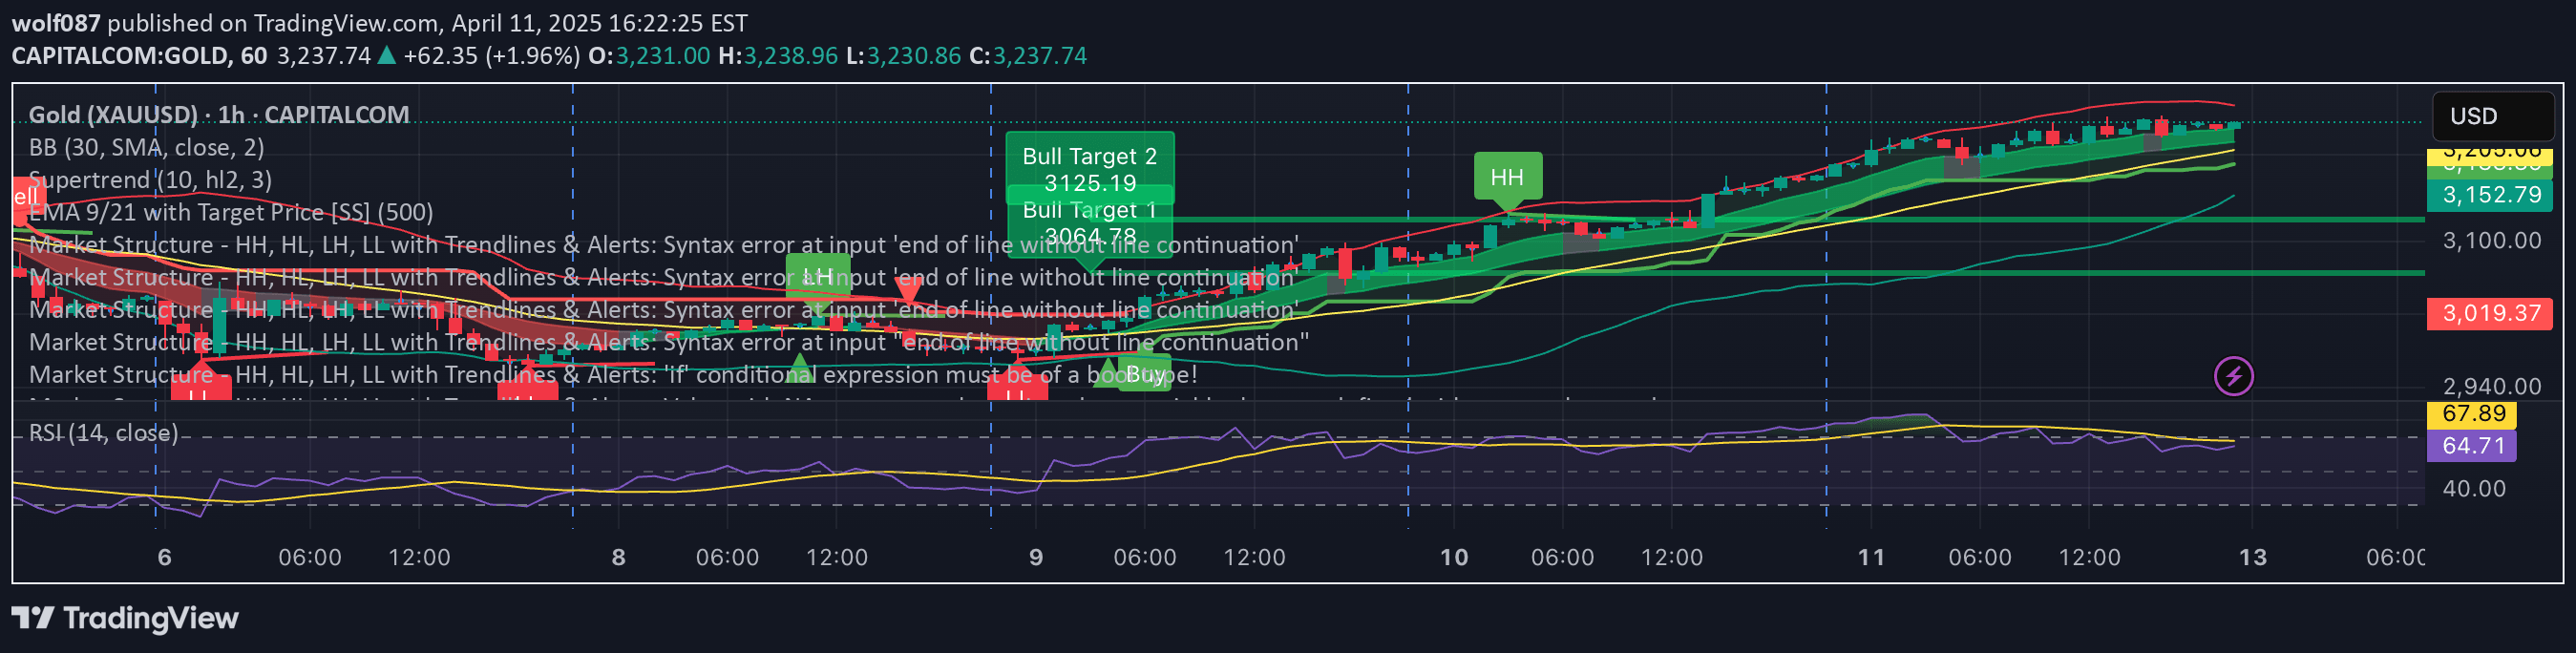
An advanced trading tool that identifies key price action structures like order blocks, market shifts, and liquidity zones to help traders analyze market dynamics and potential trading opportunities.
Explore complementary indicator rolesHow it works
The Price Action Analyst (PAA) uses complex algorithms to detect significant market patterns by analyzing price movements across different timeframes. It identifies order blocks, market structure shifts, and potential liquidity zones through advanced pattern recognition techniques.
The tool automatically plots key price levels, including supply and demand zones, fair value gaps, and trend lines. It uses pivot points, volume confirmations, and momentum indicators to determine the strength and significance of each detected market structure.
Why it may be useful
The PAA provides traders with a comprehensive visual analysis of market dynamics, helping them understand complex price action patterns that might be difficult to detect manually. By highlighting critical zones and potential market movements, it offers traders enhanced insights into market behavior and potential trading opportunities.
The tool's integrated backtesting function allows traders to evaluate the reliability of detected zones, providing statistical insights into how different market structures have historically performed. This helps traders make more informed decisions by understanding the probability of price interactions with specific market zones.
When to explore it
The Price Action Analyst is most effective in liquid markets with clear price movements, such as major forex pairs, stock indices, and high-volume commodities. It works best on intraday charts where price action patterns are more pronounced and frequent.
Traders should use this tool when seeking a comprehensive market analysis that goes beyond traditional technical indicators. It is particularly useful during periods of market transition, breakouts, and when looking to identify potential entry and exit points based on advanced price action analysis.
Keep exploring
What we’ve verified
Access, alerts and repainting behaviour have not been independently verified for this indicator. Check the creator’s current publication and settings.
General descriptions and classifications are recovered research. Verified details above identify the specific checks we have completed. Check the creator’s current publication for later changes.