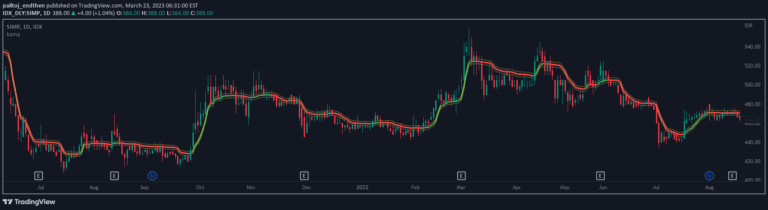
A dynamic trend-following indicator using Kaufman Adaptive Moving Averages to assess market direction and momentum through a color-coded cloud visualization.
Explore complementary indicator rolesHow it works
The KAMA Cloud calculates twenty different Kaufman Adaptive Moving Averages with lookback periods ranging from 5 to 100, using average OHLC prices. These multiple KAMAs are positioned relative to each other to determine market trend direction and momentum.
By measuring the cumulative relative distance between these KAMAs, the indicator assesses trend strength similar to how Average True Range measures volatility. The visualization creates a cloud between a base 100-period KAMA and an adjusted KAMA, which changes color based on trend direction - green for upward and red for downward trends.
Why it may be useful
The KAMA Cloud provides traders with a sophisticated, adaptive tool that dynamically responds to market volatility, offering more reliable signals than traditional moving averages. Its ability to filter market noise while highlighting trend direction makes it valuable for understanding complex market conditions.
By presenting trend information through an intuitive color-coded cloud, the indicator helps traders quickly interpret market dynamics, supporting more informed decision-making about potential entries, exits, and risk management across various asset classes.
When to explore it
The KAMA Cloud is most effective in markets with clear trending characteristics, where price movements show consistent directional momentum. It performs well across different timeframes and asset classes, including stocks, forex, commodities, and cryptocurrencies, making it versatile for multiple trading styles.
Traders should use this indicator when seeking a comprehensive view of market trends that goes beyond simple directional analysis. It is particularly useful when combined with other technical analysis tools to confirm signals and provide additional context for trading decisions.
Keep exploring
What we’ve verified
Access, alerts and repainting behaviour have not been independently verified for this indicator. Check the creator’s current publication and settings.
General descriptions and classifications are recovered research. Verified details above identify the specific checks we have completed. Check the creator’s current publication for later changes.