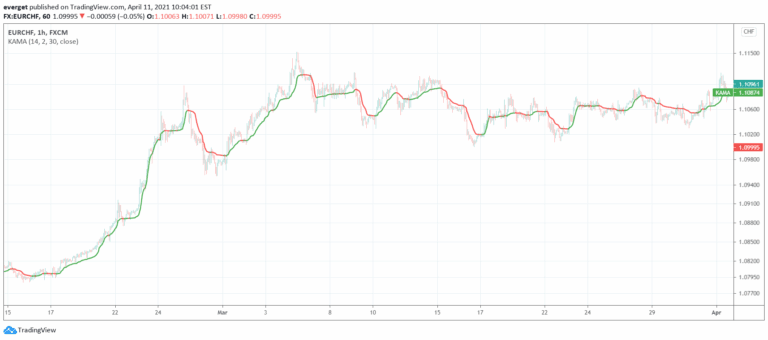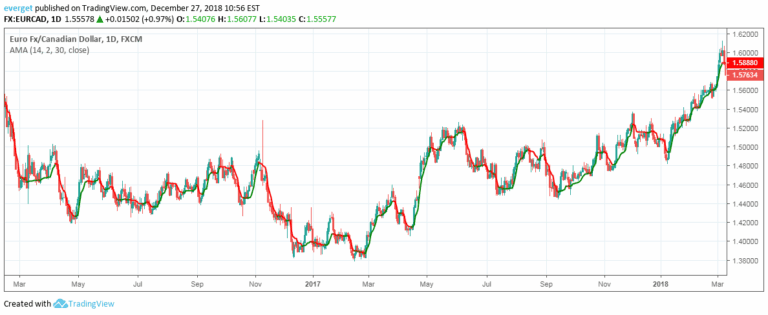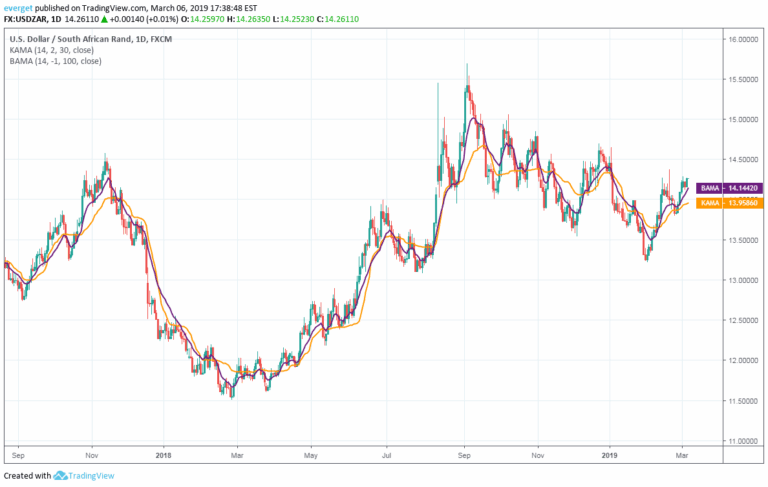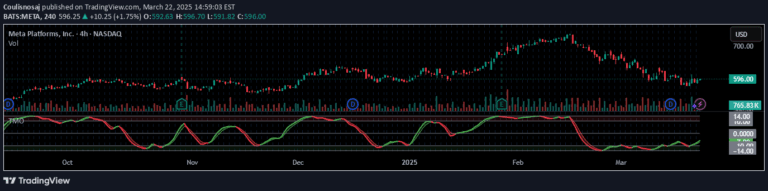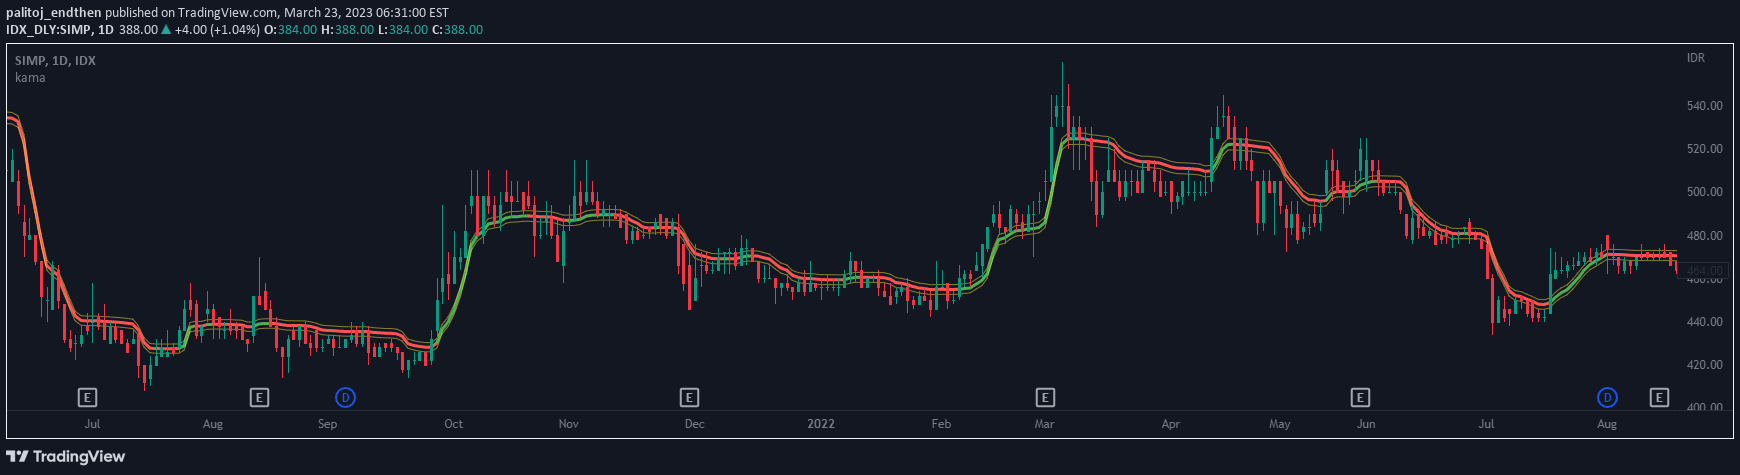
KAMA is an adaptive moving average that dynamically adjusts its smoothing based on market efficiency, providing a responsive trendline that indicates potential buy or sell signals.
Explore complementary indicator rolesHow it works
KAMA calculates a dynamic moving average by using an efficiency ratio to determine market trend smoothness. It adapts its calculation speed based on price changes, using a dominant cycle to optimize the lookback period.
The indicator computes a smoothing constant that varies between fastest and slowest settings, allowing rapid response to volatile markets and slower tracking during stable periods. By comparing current price to the KAMA trendline, traders can identify potential trend directions and momentum shifts. The smoothing constant is squared to create a more responsive calculation method
Why it may be useful
KAMA provides traders with a more adaptive and responsive trend indicator compared to traditional moving averages. By dynamically adjusting its smoothing based on market efficiency, it reduces lag and false signals during choppy markets.
The indicator helps traders identify trend strength and potential entry/exit points more accurately. Its adaptive nature allows it to perform well across different market conditions and timeframes. KAMA can help traders minimize whipsaws and improve trend-following strategies by offering a more nuanced view of price movements
When to explore it
KAMA works best in trending markets with clear directional movement, particularly in swing and day trading scenarios. It is most effective when price exhibits consistent momentum in either bullish or bearish directions. Traders should use KAMA when seeking to confirm trend strength and potential reversals.
The indicator performs well in markets with moderate volatility, helping to filter out noise and provide clearer trend signals. KAMA is particularly useful for traders wanting a more responsive trend-following tool that adapts to changing market conditions
Keep exploring
What we’ve verified
Access, alerts and repainting behaviour have not been independently verified for this indicator. Check the creator’s current publication and settings.
General descriptions and classifications are recovered research. Verified details above identify the specific checks we have completed. Check the creator’s current publication for later changes.