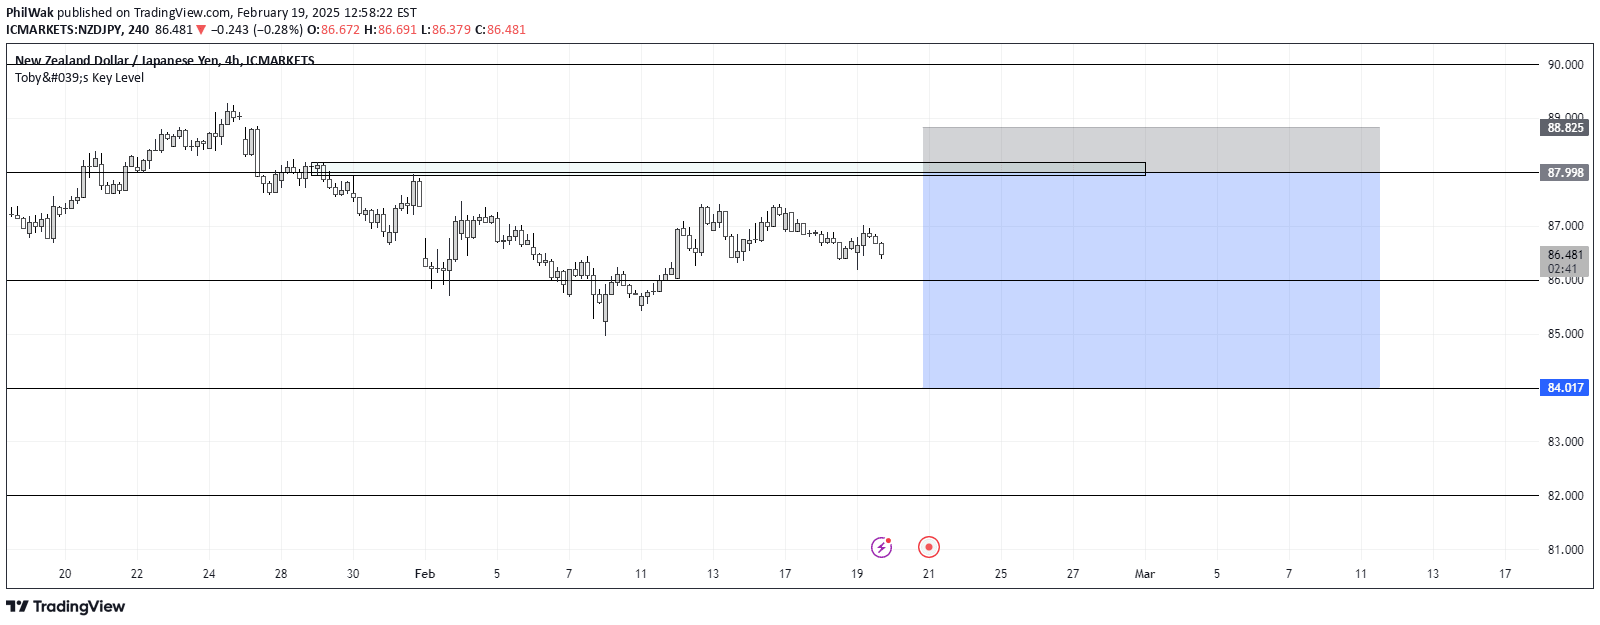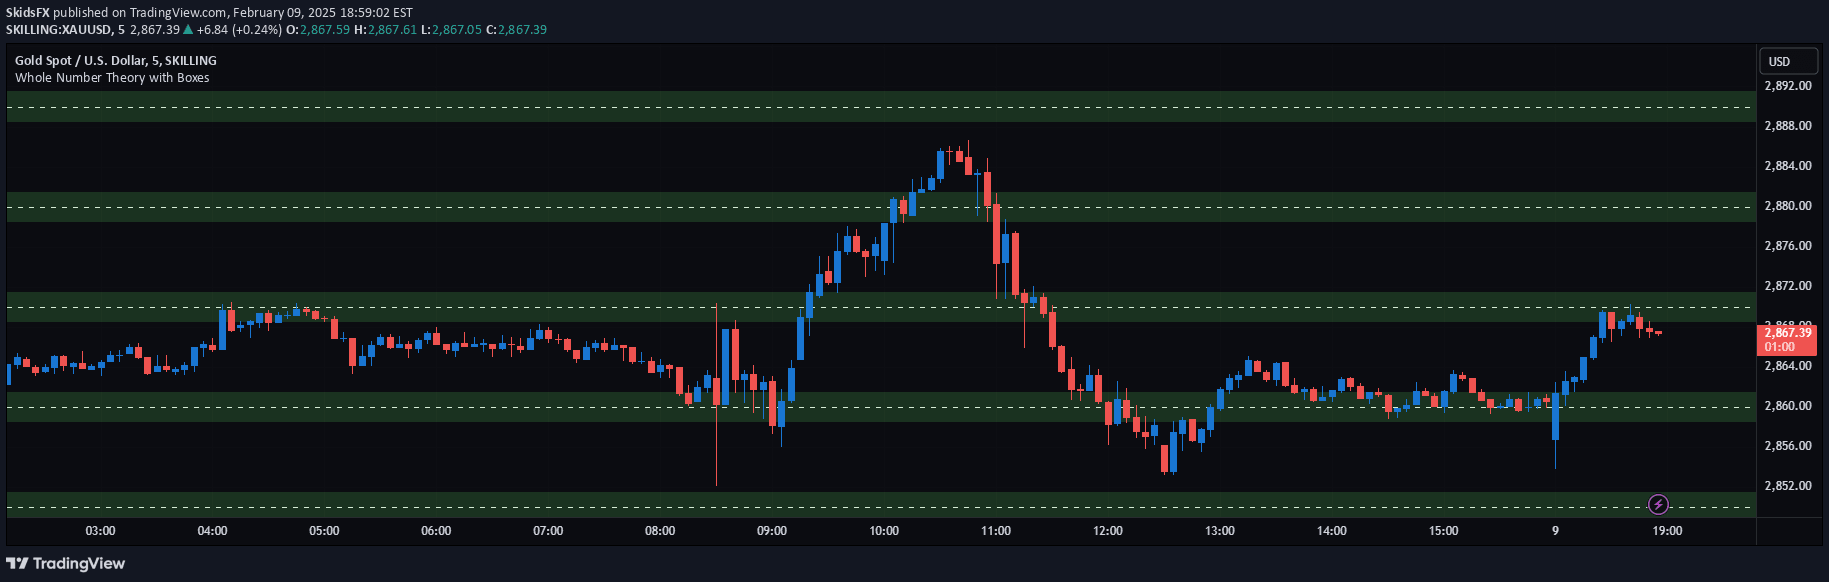
A trading visualization tool that plots key price levels with horizontal lines and boxes, helping traders identify support/resistance zones and potential price movement around whole number levels.
Explore complementary indicator rolesHow it works
The Key Levels Theory script generates horizontal lines at predetermined price levels, starting from a user-defined start price. Each line represents a whole number price point, and a customizable box is drawn above and below each line to create a visual reference zone.
The script allows traders to set the number of levels displayed, adjust the box interval, and customize line and box appearances. By drawing these levels, the tool provides a systematic way to track price movements around psychologically significant price points.
Why it may be useful
Identifying key price levels helps traders understand market psychology and potential support or resistance zones. These whole number levels often represent points where traders collectively make decisions, creating natural turning points in price movement.
By visualizing these levels, traders can anticipate potential price reactions, manage risk more effectively, and make more informed trading decisions. The boxes and lines provide a clear, objective framework for analyzing price behavior around critical levels.
When to explore it
This tool is most effective in markets with clear price level tendencies, such as stock indices, major forex pairs, and liquid commodities. It works best when price tends to respect round number levels and shows predictable behavior around psychological price points.
Traders can utilize this signal during range-bound markets, trend reversals, and when seeking to identify potential entry and exit points. It is particularly useful for traders who want a systematic approach to understanding price dynamics and market sentiment.
Keep exploring
What we’ve verified
Access, alerts and repainting behaviour have not been independently verified for this indicator. Check the creator’s current publication and settings.
General descriptions and classifications are recovered research. Verified details above identify the specific checks we have completed. Check the creator’s current publication for later changes.