
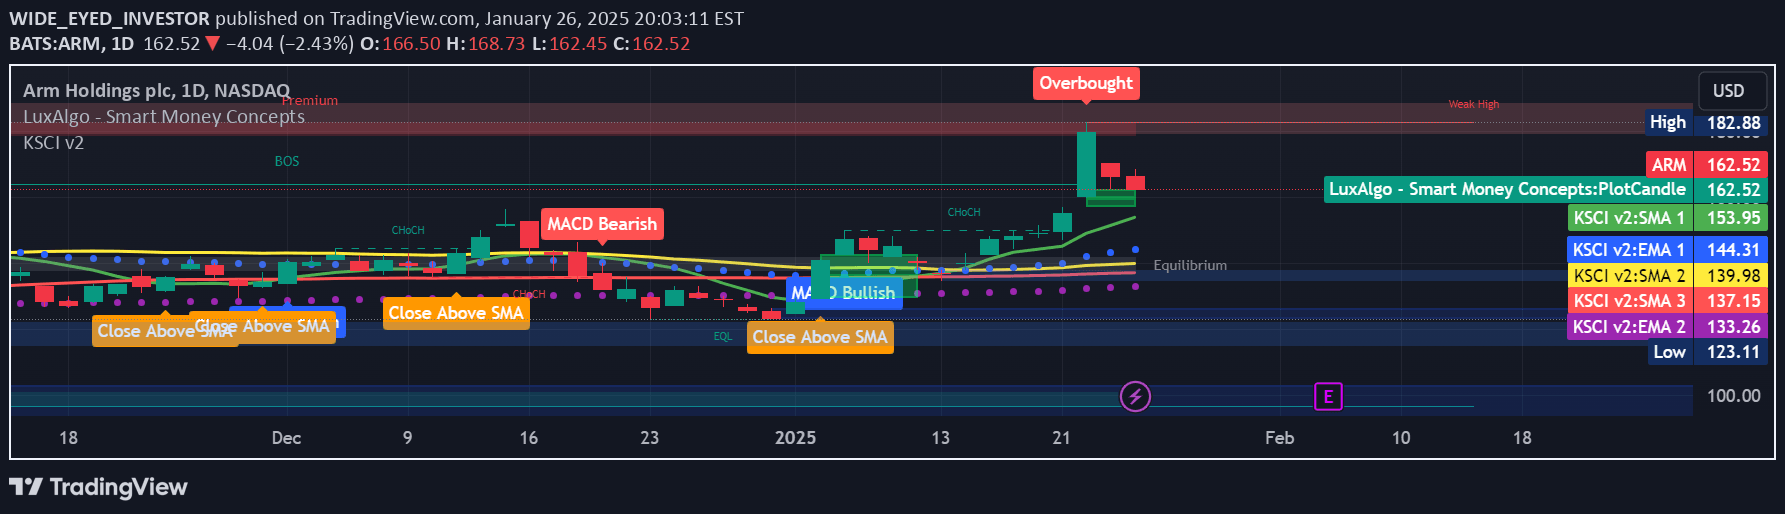
A comprehensive TradingView indicator combining multiple technical analysis tools like moving averages, RSI, and MACD to help traders identify trend directions and potential trading opportunities.
Explore complementary indicator rolesHow it works
The Kubricks Super Colliding Indicator integrates multiple technical analysis techniques to generate trading signals. It calculates Simple and Exponential Moving Averages across different periods, tracking price momentum and potential trend changes. The indicator also computes the Relative Strength Index and Moving Average Convergence Divergence to provide additional insight into market conditions.
By analyzing crossovers, overbought/oversold levels, and trend confirmations, the script generates visual alerts and potential entry/exit points. Traders can customize the indicator's settings, enabling or disabling specific features to match their unique trading strategy and preferences.
Why it may be useful
Technical analysis tools help traders make more informed decisions by providing objective insights into market behavior and potential price movements. This comprehensive indicator consolidates multiple analytical methods, allowing traders to quickly assess market conditions without switching between different tools or charts.
By combining trend, momentum, and signal indicators, the script offers a holistic view of market dynamics. Traders can leverage these integrated insights to identify potential trading opportunities, confirm trend directions, and make more strategic entry and exit decisions.
When to explore it
The Kubricks Super Colliding Indicator is most effective in markets with clear trend movements and sufficient price volatility. It performs well across various timeframes, making it suitable for scalpers, day traders, and swing traders seeking comprehensive market analysis. Traders should use the indicator in conjunction with other analysis methods and risk management strategies.
The indicator is particularly useful during periods of market transition, such as potential trend reversals or momentum shifts. By providing multiple perspectives on market conditions, it helps traders identify potential trading opportunities and make more informed decisions across different market environments.
Keep exploring
What we’ve verified
Access, alerts and repainting behaviour have not been independently verified for this indicator. Check the creator’s current publication and settings.
General descriptions and classifications are recovered research. Verified details above identify the specific checks we have completed. Check the creator’s current publication for later changes.


