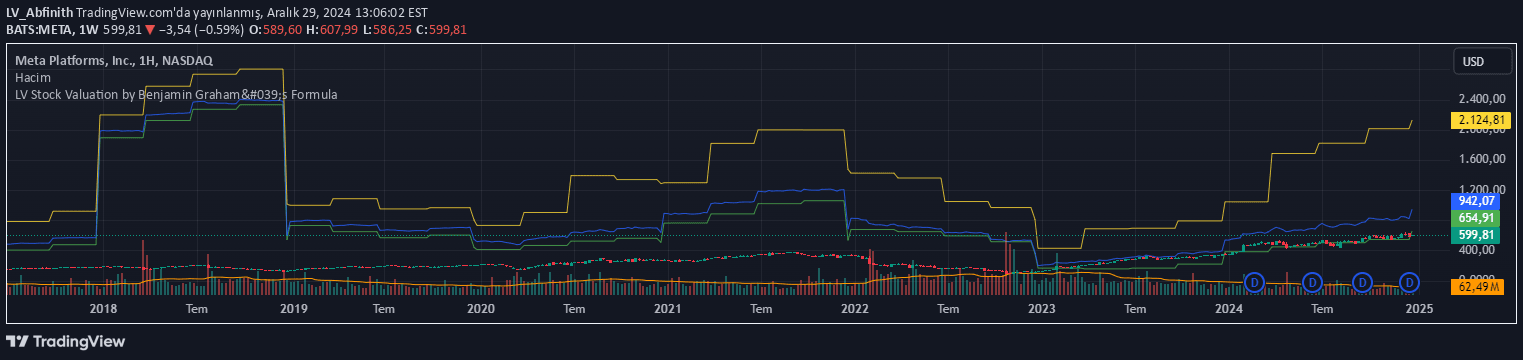
A dynamic indicator that tracks price levels and trend direction, offering adaptive calculations and color-coded visual insights into market movements and potential trend changes.
Explore complementary indicator rolesHow it works
The indicator continuously recalculates price levels by analyzing market conditions in real-time, creating dynamic support and resistance zones. It tracks how long prices remain above or below specific levels to determine trend direction, utilizing sophisticated algorithmic calculations.
By employing customizable sensitivity settings, the indicator adjusts its calculations to provide responsive and accurate trend identification. The system generates color-coded visual representations that help traders quickly understand market dynamics, with different colors signaling various trend states and price level interactions.
Why it may be useful
Dynamic price level tracking provides traders with a more nuanced understanding of market movements compared to static indicators. By offering adaptive calculations, the indicator helps traders identify potential trend shifts earlier and with greater precision, reducing the risk of misinterpreting market signals.
The color-coded visualization simplifies complex market data, allowing traders to make faster and more informed decisions. Its ability to dynamically adjust to changing market conditions makes it a versatile tool for traders seeking real-time insights into price behavior and trend momentum.
When to explore it
This indicator is most effective in markets with moderate to high volatility, where price levels and trends change rapidly. It performs exceptionally well in timeframes ranging from minute to hourly charts, making it ideal for scalping and day trading strategies.
Traders should use this indicator when seeking a comprehensive view of market dynamics that goes beyond traditional static support and resistance levels. It is particularly useful during periods of market transition, helping identify potential trend reversals and providing early warning signals for significant price movements.
Keep exploring
What we’ve verified
Access, alerts and repainting behaviour have not been independently verified for this indicator. Check the creator’s current publication and settings.
General descriptions and classifications are recovered research. Verified details above identify the specific checks we have completed. Check the creator’s current publication for later changes.