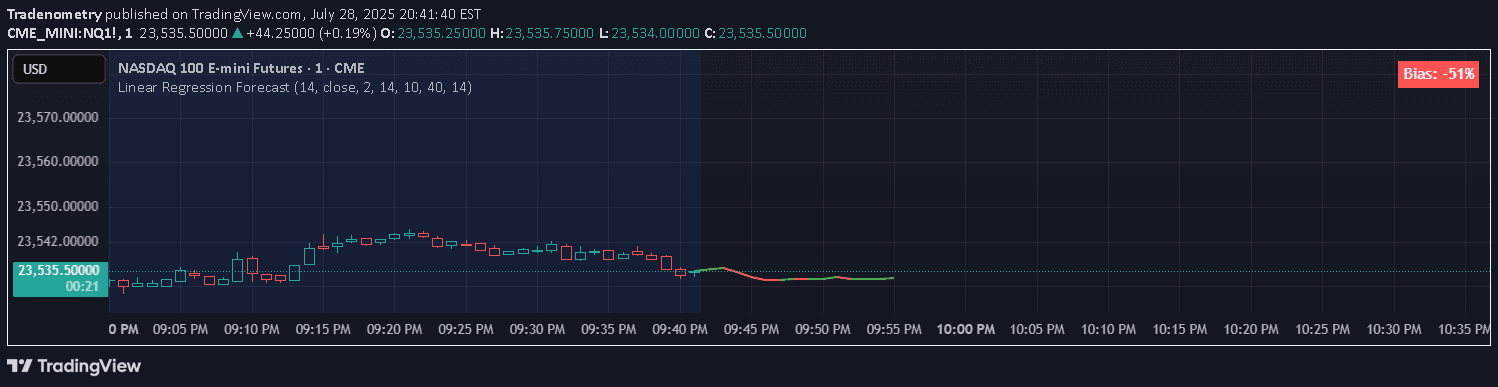
Linear Regression Intercept is a statistical method that calculates a trendline's intercept to forecast market direction and identify potential price trends and trading opportunities.
Explore complementary indicator rolesHow it works
Linear Regression Intercept (LRI) uses mathematical calculations to create a predictive trendline based on historical price data. It determines the slope and intercept of a regression line by applying the least squares method, which minimizes the distance between observed price points and the calculated line.
The calculation involves computing the slope using the difference between data points and their respective means, then determining the intercept where the line crosses the price axis. Traders can adjust the period of calculation to modify the indicator's sensitivity, allowing for more precise trend analysis and potential market insights.
Why it may be useful
The Linear Regression Intercept provides traders with a statistical approach to understanding market trends and potential price movements. By offering a mathematical perspective on price direction, it helps traders make more informed decisions about market entry and exit points.
This indicator is valuable because it transforms complex price data into a clear, interpretable trend signal. It allows traders to objectively assess market momentum, identify potential trend reversals, and develop more systematic trading strategies based on quantitative analysis rather than purely subjective observations.
When to explore it
The Linear Regression Intercept is most effective in markets with clear trending characteristics, where price movements follow a relatively consistent pattern. It works best when combined with other technical indicators to confirm signals and provide a more comprehensive market analysis.
Traders should consider using LRI during periods of stable market conditions, such as when prices are showing consistent directional movement in stocks, forex, or commodities. It is particularly useful for identifying potential trend changes and confirming the strength and direction of existing market trends across various timeframes.
Keep exploring
What we’ve verified
Access, alerts and repainting behaviour have not been independently verified for this indicator. Check the creator’s current publication and settings.
General descriptions and classifications are recovered research. Verified details above identify the specific checks we have completed. Check the creator’s current publication for later changes.