
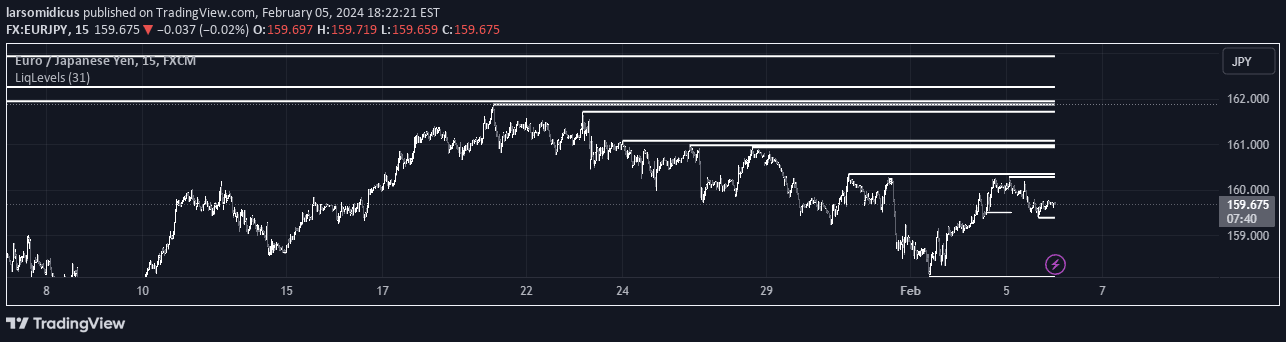
A TradingView indicator that identifies market liquidity levels by highlighting pivot highs and lows, helping traders recognize potential market movement and reversal points.
Explore complementary indicator rolesHow it works
The Liquidity Levels indicator analyzes price action by identifying pivot highs and lows with an adjustable offset. It calculates these pivots based on either closing prices or high/low prices, allowing for flexible market analysis. The indicator marks these significant points on the chart to reveal areas of potential market interest.
By creating visual lines at these pivot points, the indicator helps traders understand where liquidity might be concentrated. The adjustable offset allows traders to customize the sensitivity and length of the identified levels, making the tool adaptable to different trading styles and market conditions.
Why it may be useful
Understanding liquidity levels is crucial for traders as these points can indicate potential market movements, reversals, or areas of significant trading activity. By highlighting these key levels, traders can make more informed decisions about entry and exit points, reducing the risk of trading in low-liquidity zones.
The indicator provides a visual representation of market structure, helping traders identify potential support and resistance areas. This can be particularly valuable in volatile markets where understanding liquidity can provide a strategic advantage in trading decisions.
When to explore it
The Liquidity Levels indicator is most effective in markets with clear price action and identifiable pivot points. It works best in timeframes that allow for sufficient price movement to establish meaningful pivots, such as intraday, daily, or weekly charts. Traders can use this tool across various asset classes, including stocks, forex, cryptocurrencies, and commodities.
The indicator is particularly useful during trending markets, range-bound conditions, and when seeking to confirm potential breakout or reversal points. Traders should combine this tool with other technical analysis methods to validate signals and improve overall trading strategy.
Keep exploring
What we’ve verified
Access, alerts and repainting behaviour have not been independently verified for this indicator. Check the creator’s current publication and settings.
General descriptions and classifications are recovered research. Verified details above identify the specific checks we have completed. Check the creator’s current publication for later changes.


